Feel free to leave your vote:
0
Share template with others
Summary
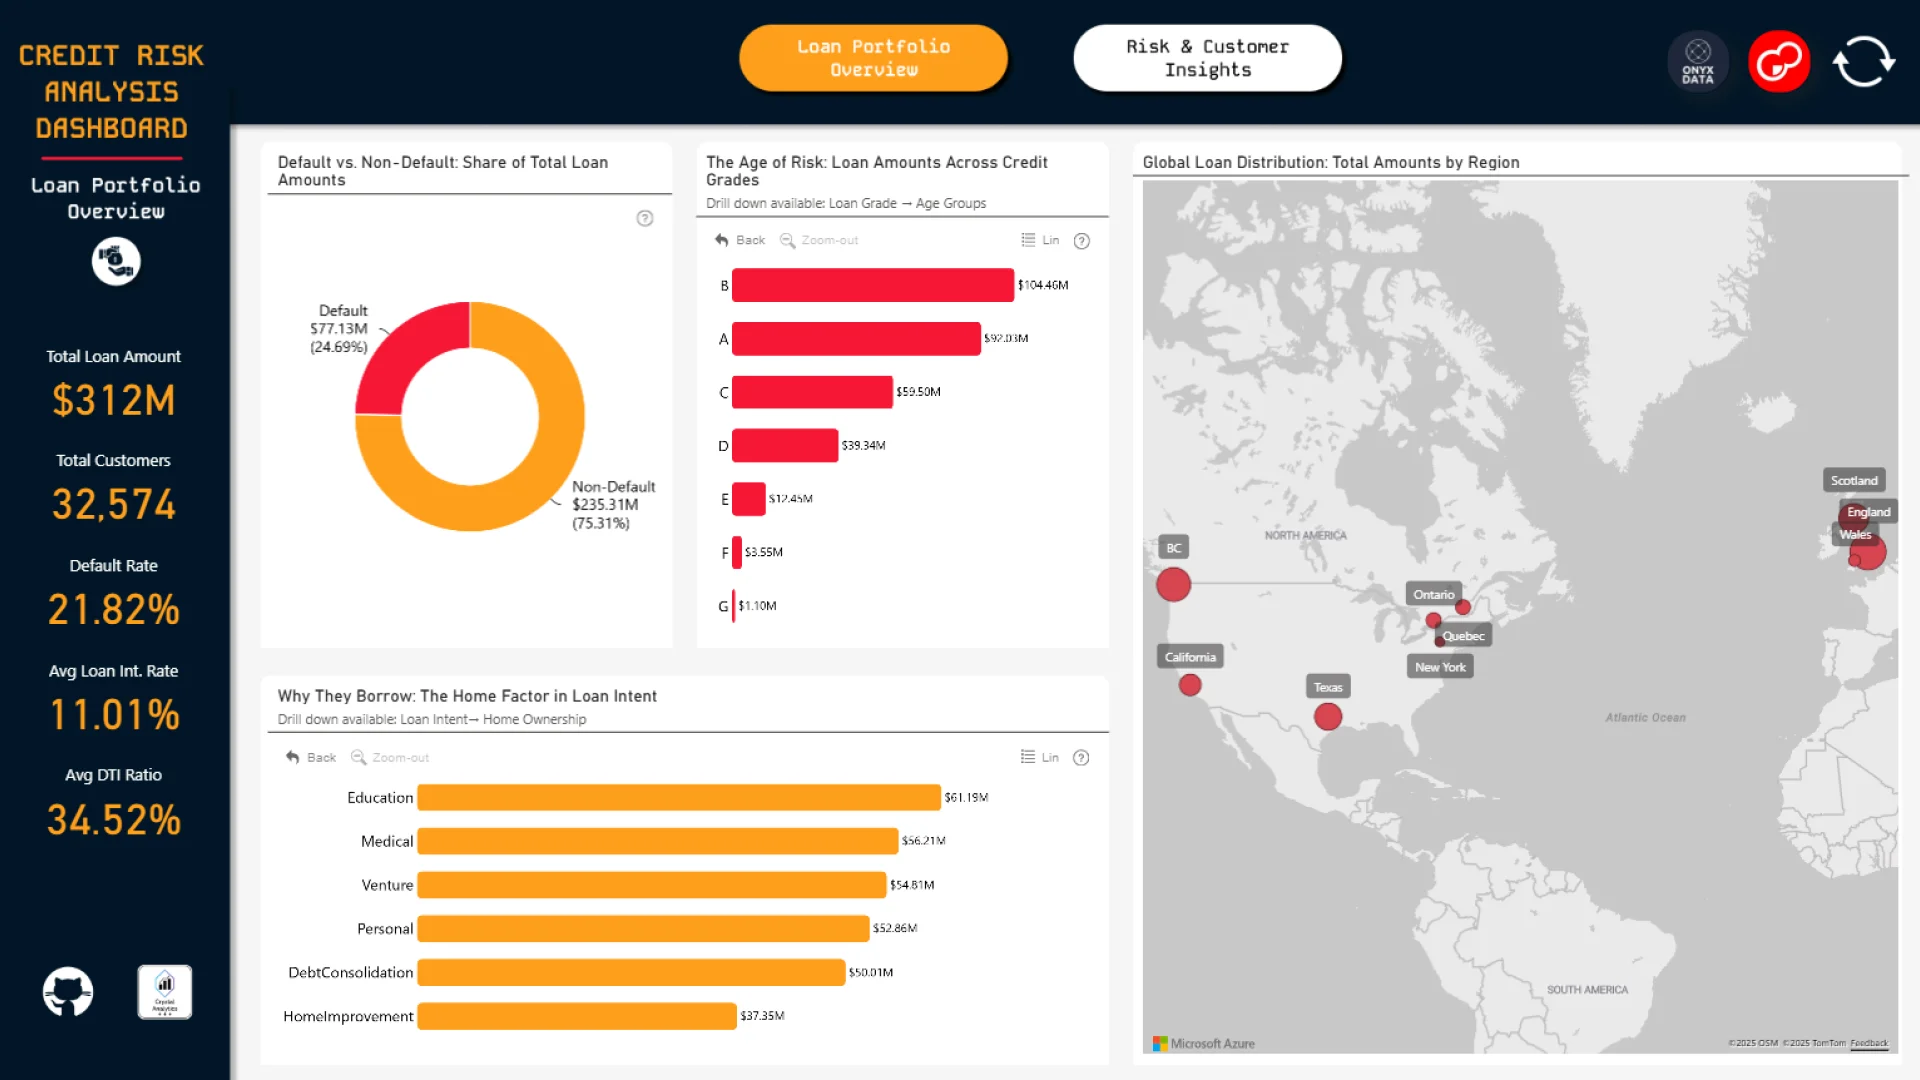
This Power BI report uses the Credit Bank Risk Dataset and features ZoomCharts Drill Down PRO custom visuals for Power BI. It was submitted to the Onyx Data DataDNA ZoomCharts Mini Challenge in September 2025.
Author's Description:
This Credit Risk Dashboard is a 2-page interactive Power BI report that combines portfolio insights with risk analysis. The first page offers a high-level overview through KPIs, loan status distribution, borrowing purposes, credit grades, and geographical hotspots to assess overall portfolio health. The second page dives into risk and customer behavior, highlighting debt-to-income ratio buckets, interest rates by grade, income versus loan amount patterns, demographic breakdowns, and the impact of credit history length on defaults. Together, the dashboard provides a clear picture of lending performance while identifying the drivers of borrower risk.
Mobile view allows you to interact with the report. To Download the template please switch to desktop view.
