Feel free to leave your vote:
0
Share template with others
Summary
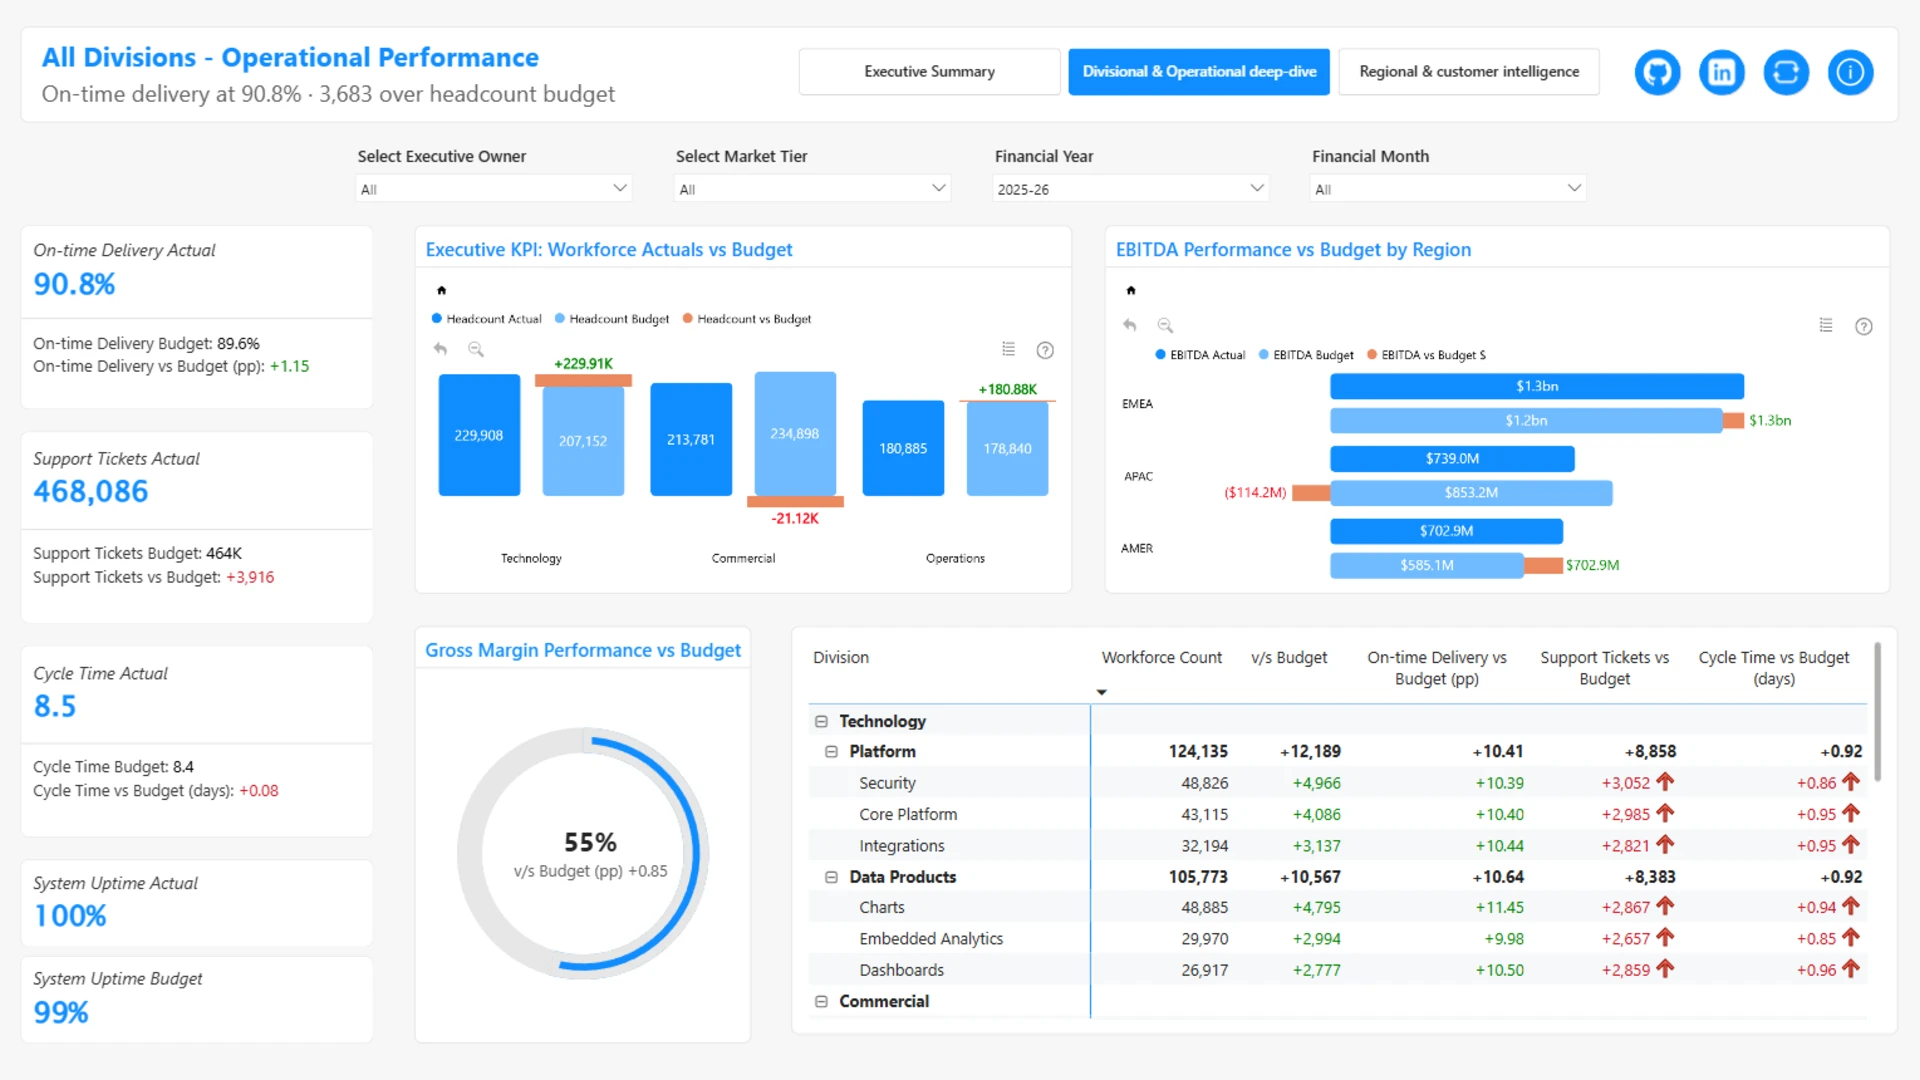
This interactive Power BI report presents an executive KPI dashboard built with ZoomCharts Drill Down custom visuals for Power BI. It highlights key metrics such as Revenue, EBITDA, Margin, Headcount, and Customer Growth, with Actual vs Budget vs Forecast comparisons, organizational drill-down, and regional performance analysis to support strategic decision-making.
The report was submitted to the ZoomCharts “4U Reports Challenge” (April 2026), using ZoomCharts Drill Down custom visuals for Power BI.
Author's Description:
This dashboard delivers a complete view of business performance across Finance, Operations, Customers and People over a 24 month period, structured into three main pages with two interactive drill-through views. It combines executive-level KPIs, divisional and operational insights, and regional and customer analysis with dynamic visuals, maps and scorecards. Users can drill through to Division and Country level for deeper insights into trends, performance metrics and granular breakdowns across business units and products.
ZoomCharts visuals used
Mobile view allows you to interact with the report. To Download the template please switch to desktop view.