Feel free to leave your vote:
0
Share template with others
Summary
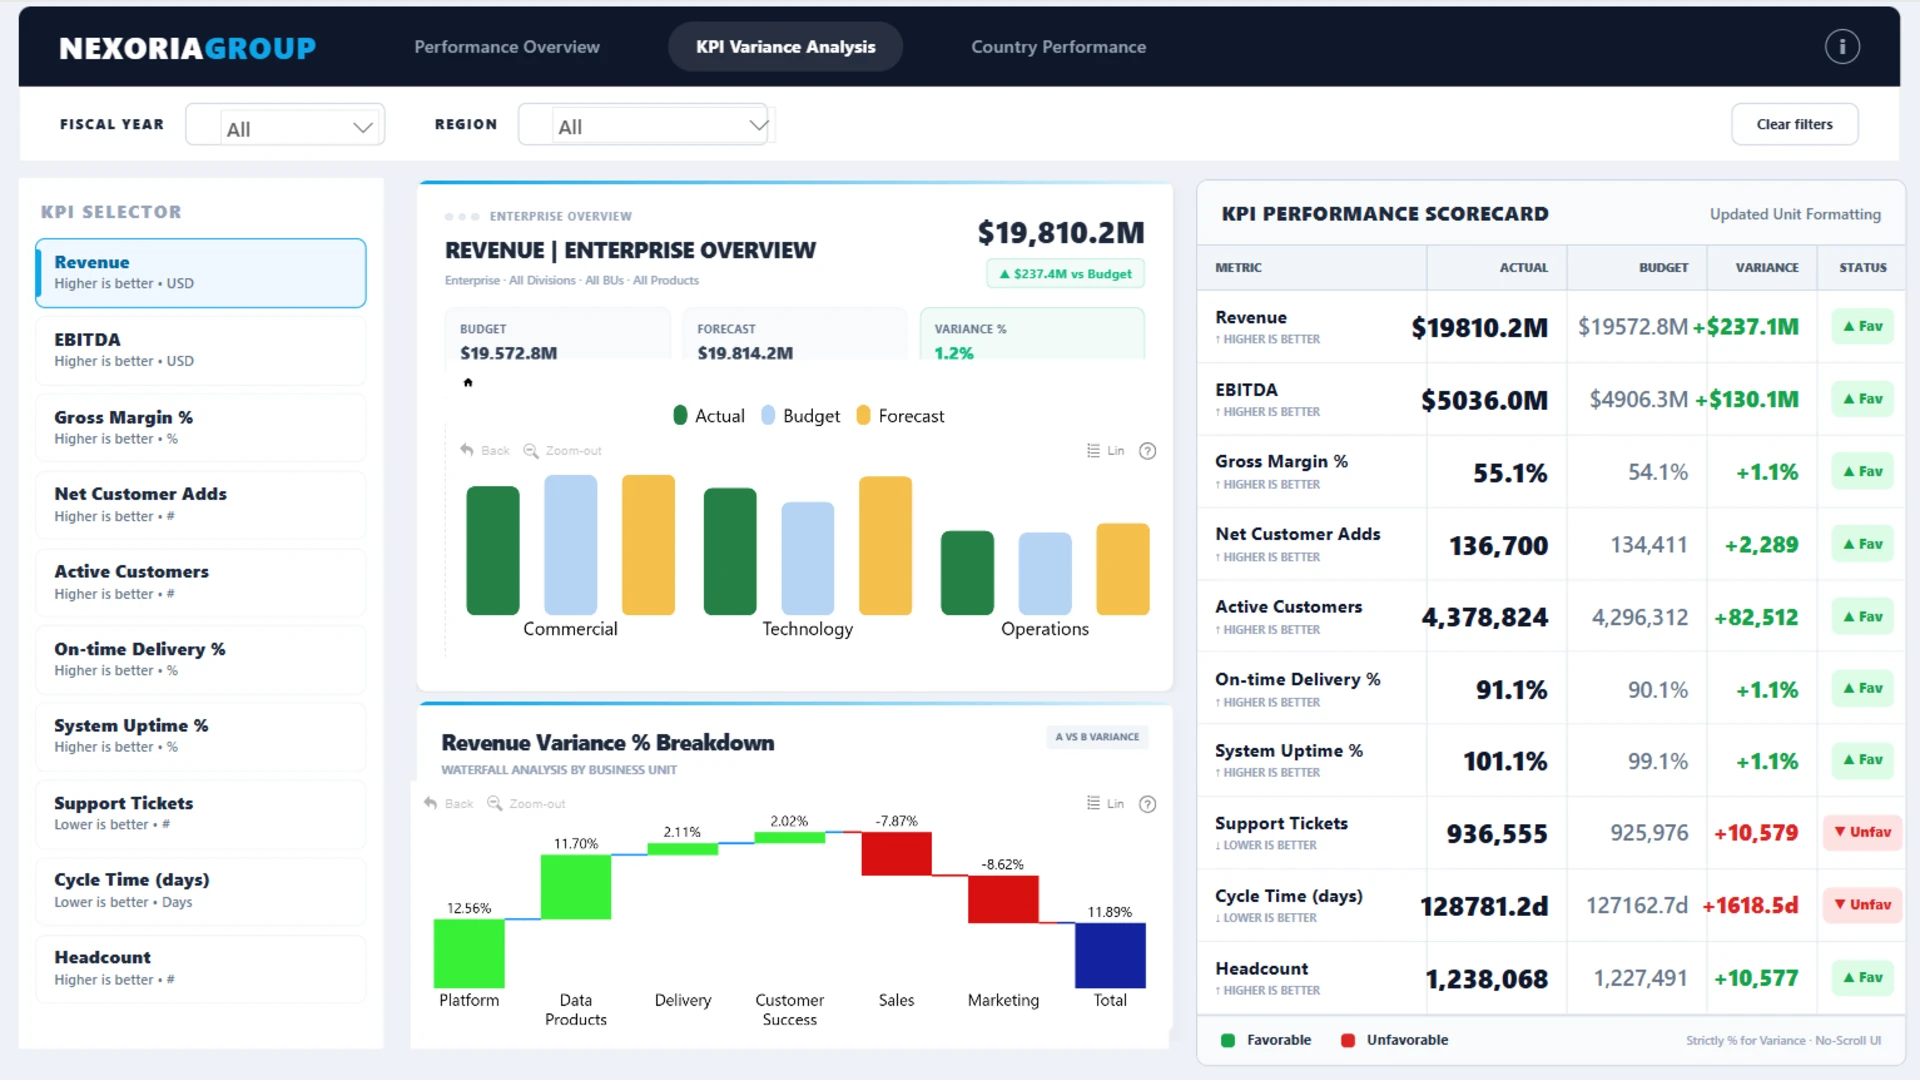
This interactive Power BI report presents an executive KPI dashboard built with ZoomCharts Drill Down custom visuals for Power BI. It highlights key metrics such as Revenue, EBITDA, Margin, Headcount, and Customer Growth, with Actual vs Budget vs Forecast comparisons, organizational drill-down, and regional performance analysis to support strategic decision-making.
The report was submitted to the ZoomCharts “4U Reports Challenge” (April 2026), using ZoomCharts Drill Down custom visuals for Power BI.
Author's Description:
This report is built around a clear executive performance architecture, with a high-level overview acting as a “North Star” through dynamic KPI scorecards, multi-year trend analysis, and regional benchmarking across EMEA, APAC, and AMER. It includes a dedicated variance and attribution layer, using waterfall analysis and a balanced scorecard to explain performance drivers across both financial and operational metrics. A geographic deep-dive enables country-level analysis with performance rankings and structured regional hierarchies for easy navigation. The design follows a consistent visual language with intuitive color logic, global filters, and interactive navigation to ensure clarity and usability for executive users.
Mobile view allows you to interact with the report. To Download the template please switch to desktop view.