Feel free to leave your vote:
0
Share template with others
Summary
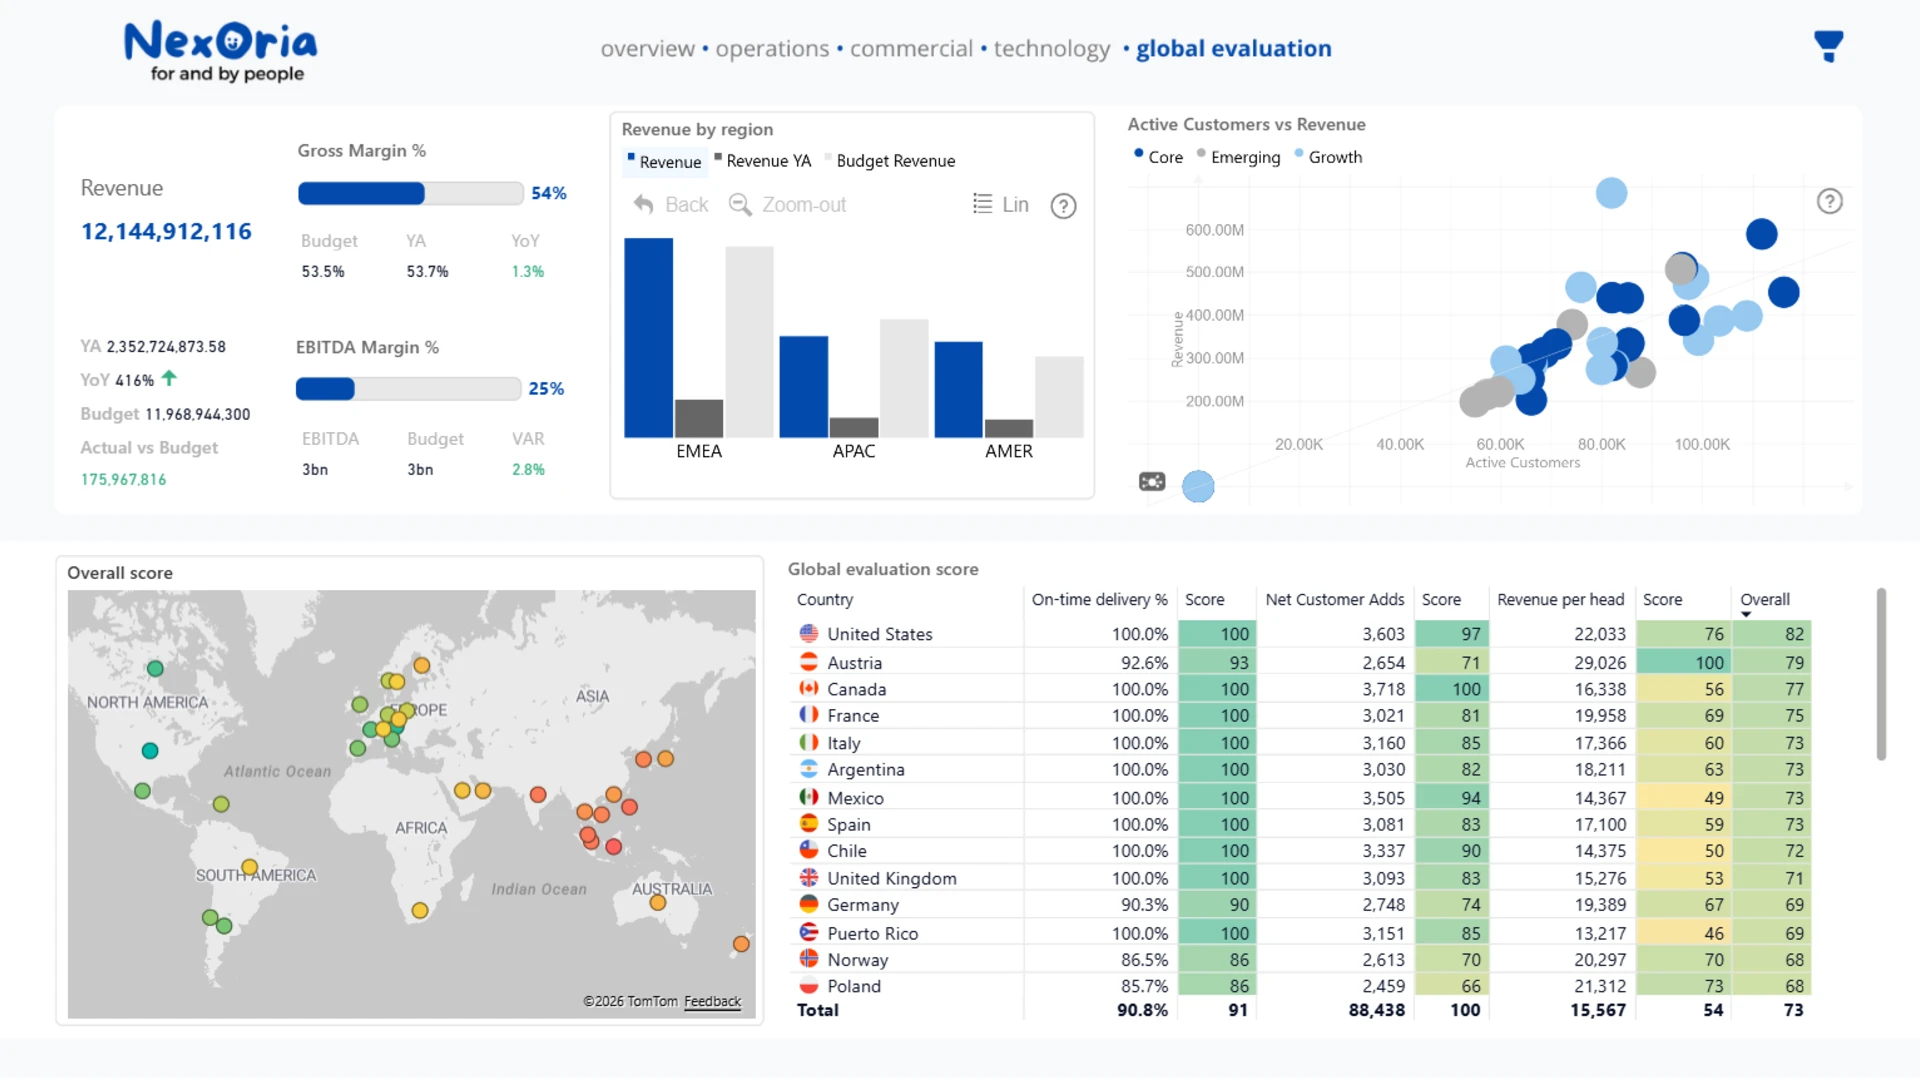
This interactive Power BI report presents an executive KPI dashboard built with ZoomCharts Drill Down custom visuals for Power BI. It highlights key metrics such as Revenue, EBITDA, Margin, Headcount, and Customer Growth, with Actual vs Budget vs Forecast comparisons, organizational drill-down, and regional performance analysis to support strategic decision-making.
The report was submitted to the ZoomCharts “4U Reports Challenge” (April 2026), using ZoomCharts Drill Down custom visuals for Power BI.
Author's Description:
The purpose of this report is to raise participants’ awareness of the results the company is achieving, as well as to identify areas for improvement based on the roles of the leaders involved in decision-making, in order to develop strategies that will lead to better results in each area.
Mobile view allows you to interact with the report. To Download the template please switch to desktop view.