Feel free to leave your vote:
0
Share template with others
Summary
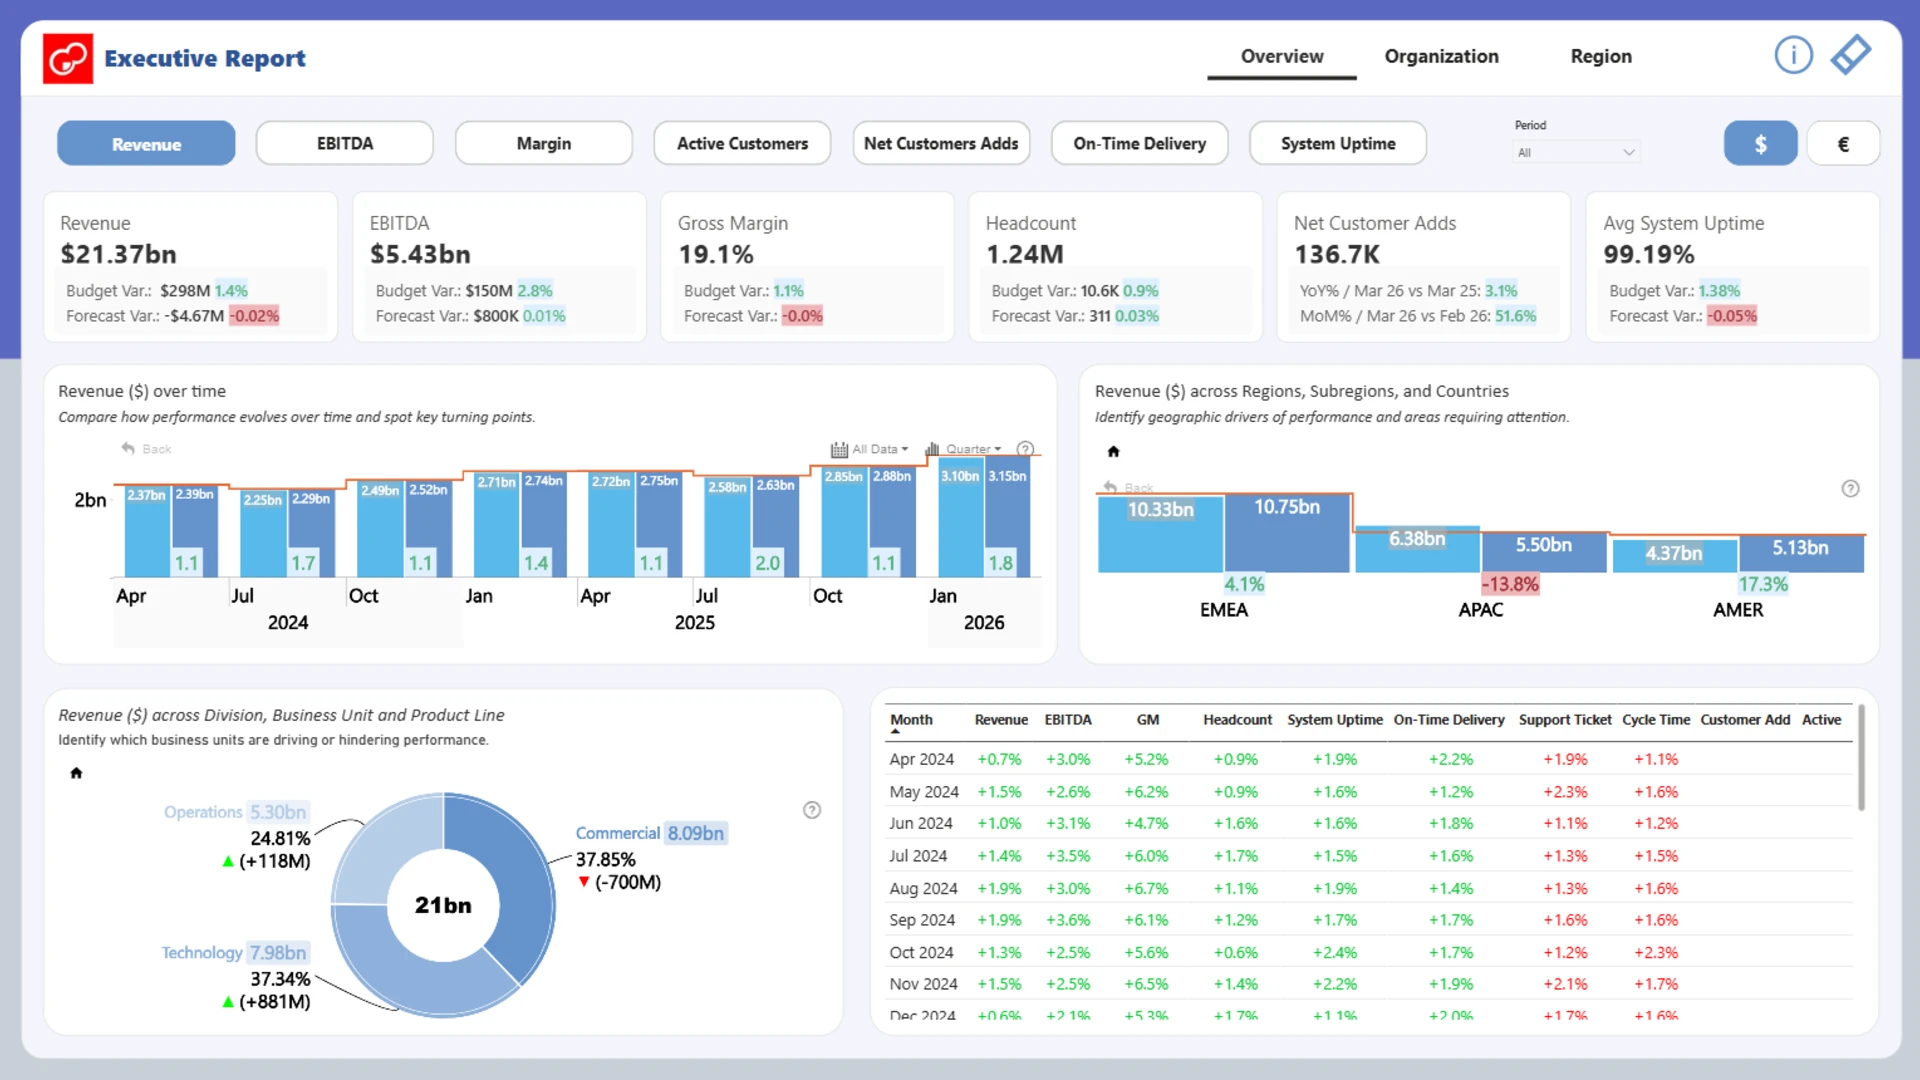
This interactive Power BI report presents an executive KPI dashboard built with ZoomCharts Drill Down custom visuals for Power BI. It highlights key metrics such as Revenue, EBITDA, Margin, Headcount, and Customer Growth, with Actual vs Budget vs Forecast comparisons, organizational drill-down, and regional performance analysis to support strategic decision-making.
The report was submitted to the ZoomCharts “4U Reports Challenge” (April 2026), using ZoomCharts Drill Down custom visuals for Power BI.
Author's Description:
This report presents an executive view of performance across financial, operational, and customer KPIs, enabling dynamic analysis by time, geography, and organizational structure. It highlights trends, budget variances, and key drivers of performance to support data-driven decision-making and identify areas of strength and improvement.
ZoomCharts visuals used
Mobile view allows you to interact with the report. To Download the template please switch to desktop view.