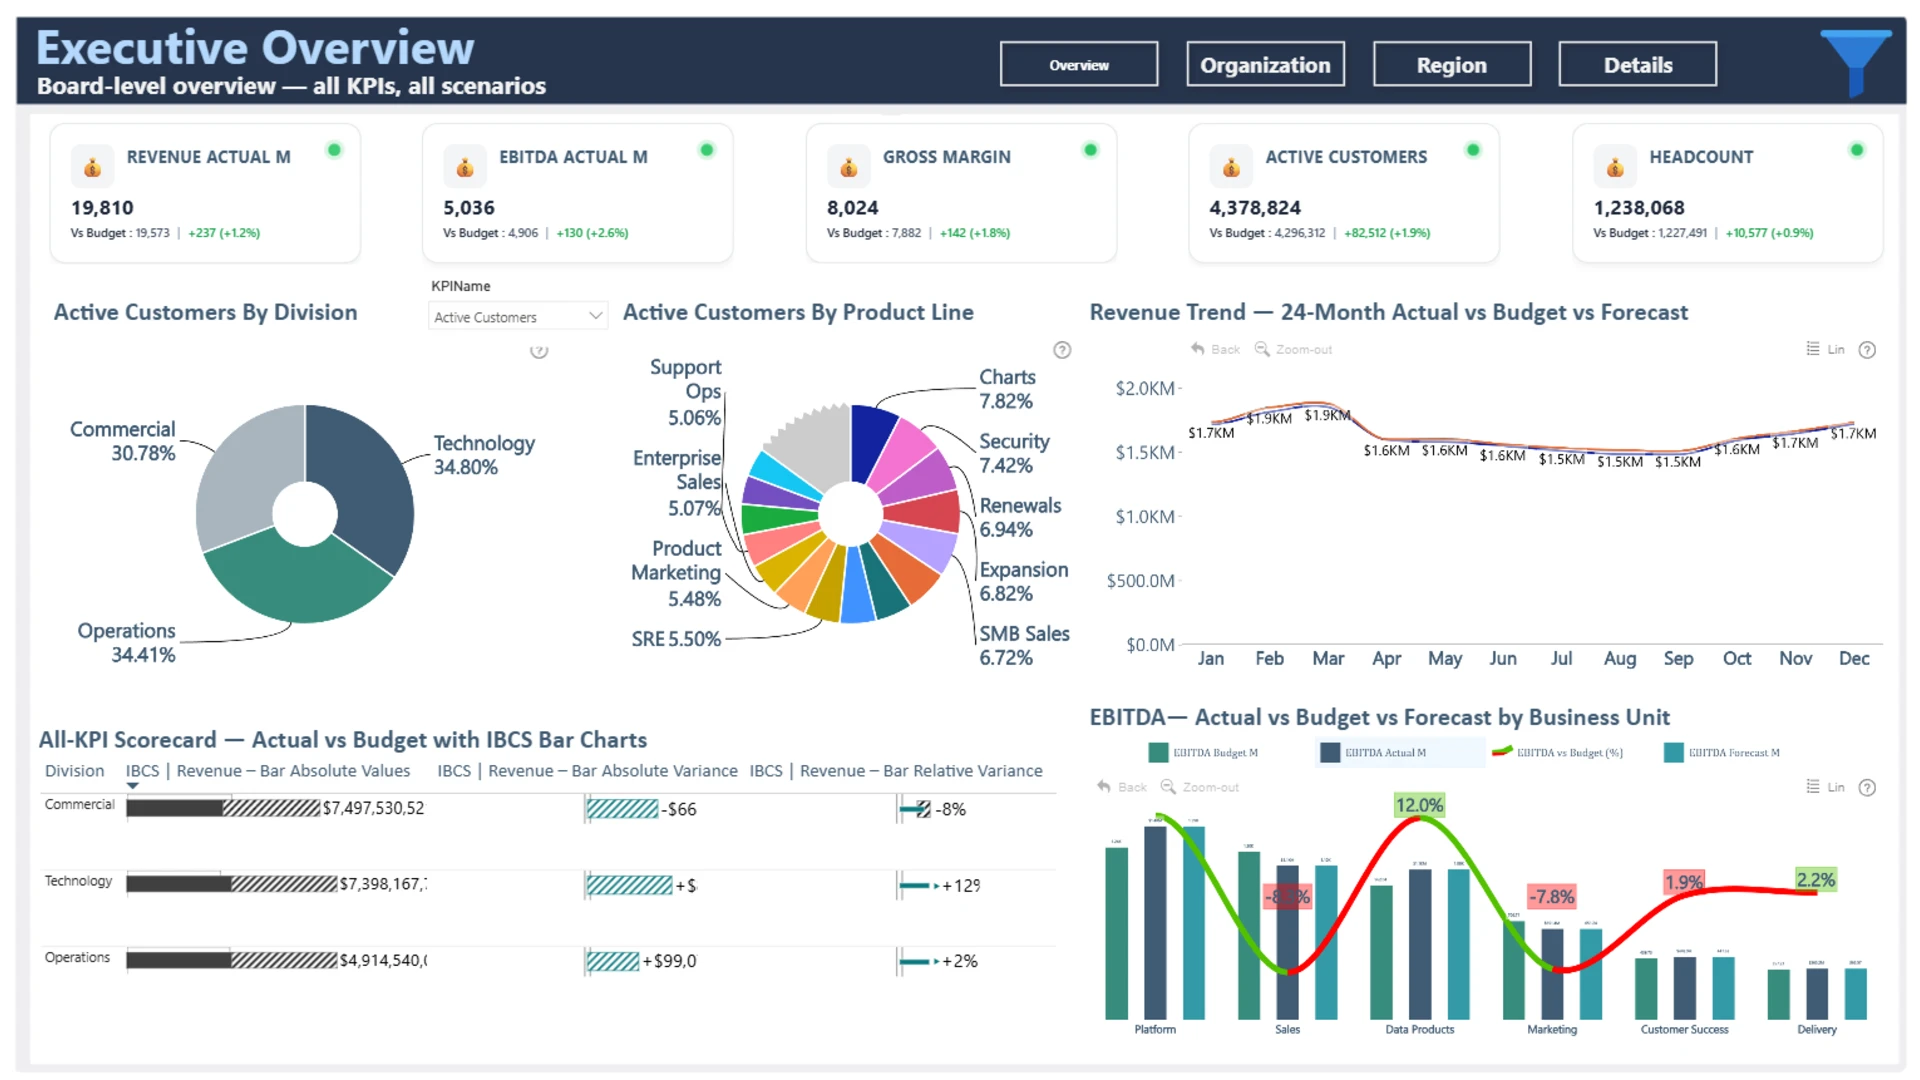
This interactive Power BI report presents an executive KPI dashboard built with ZoomCharts Drill Down custom visuals for Power BI. It highlights key metrics such as Revenue, EBITDA, Margin, Headcount, and Customer Growth, with Actual vs Budget vs Forecast comparisons, organizational drill-down, and regional performance analysis to support strategic decision-making.
The report was submitted to the ZoomCharts “4U Reports Challenge” (April 2026), using ZoomCharts Drill Down custom visuals for Power BI.
Author's Description:
This Power BI report presents a modern Executive KPI dashboard designed to support enterprise-level strategic decision-making. It provides a comprehensive view of financial, operational, and regional performance, enabling leaders to track trends, identify variances, and spot risks and opportunities in real time. The dashboard features dynamic KPI indicators, financial and operational insights, and interactive drill-through capabilities within a clean, executive-focused interface. It also demonstrates advanced Power BI techniques, including optimized DAX, custom KPI logic, and strong UI/UX design.