Feel free to leave your vote:
0
Share template with others
Summary
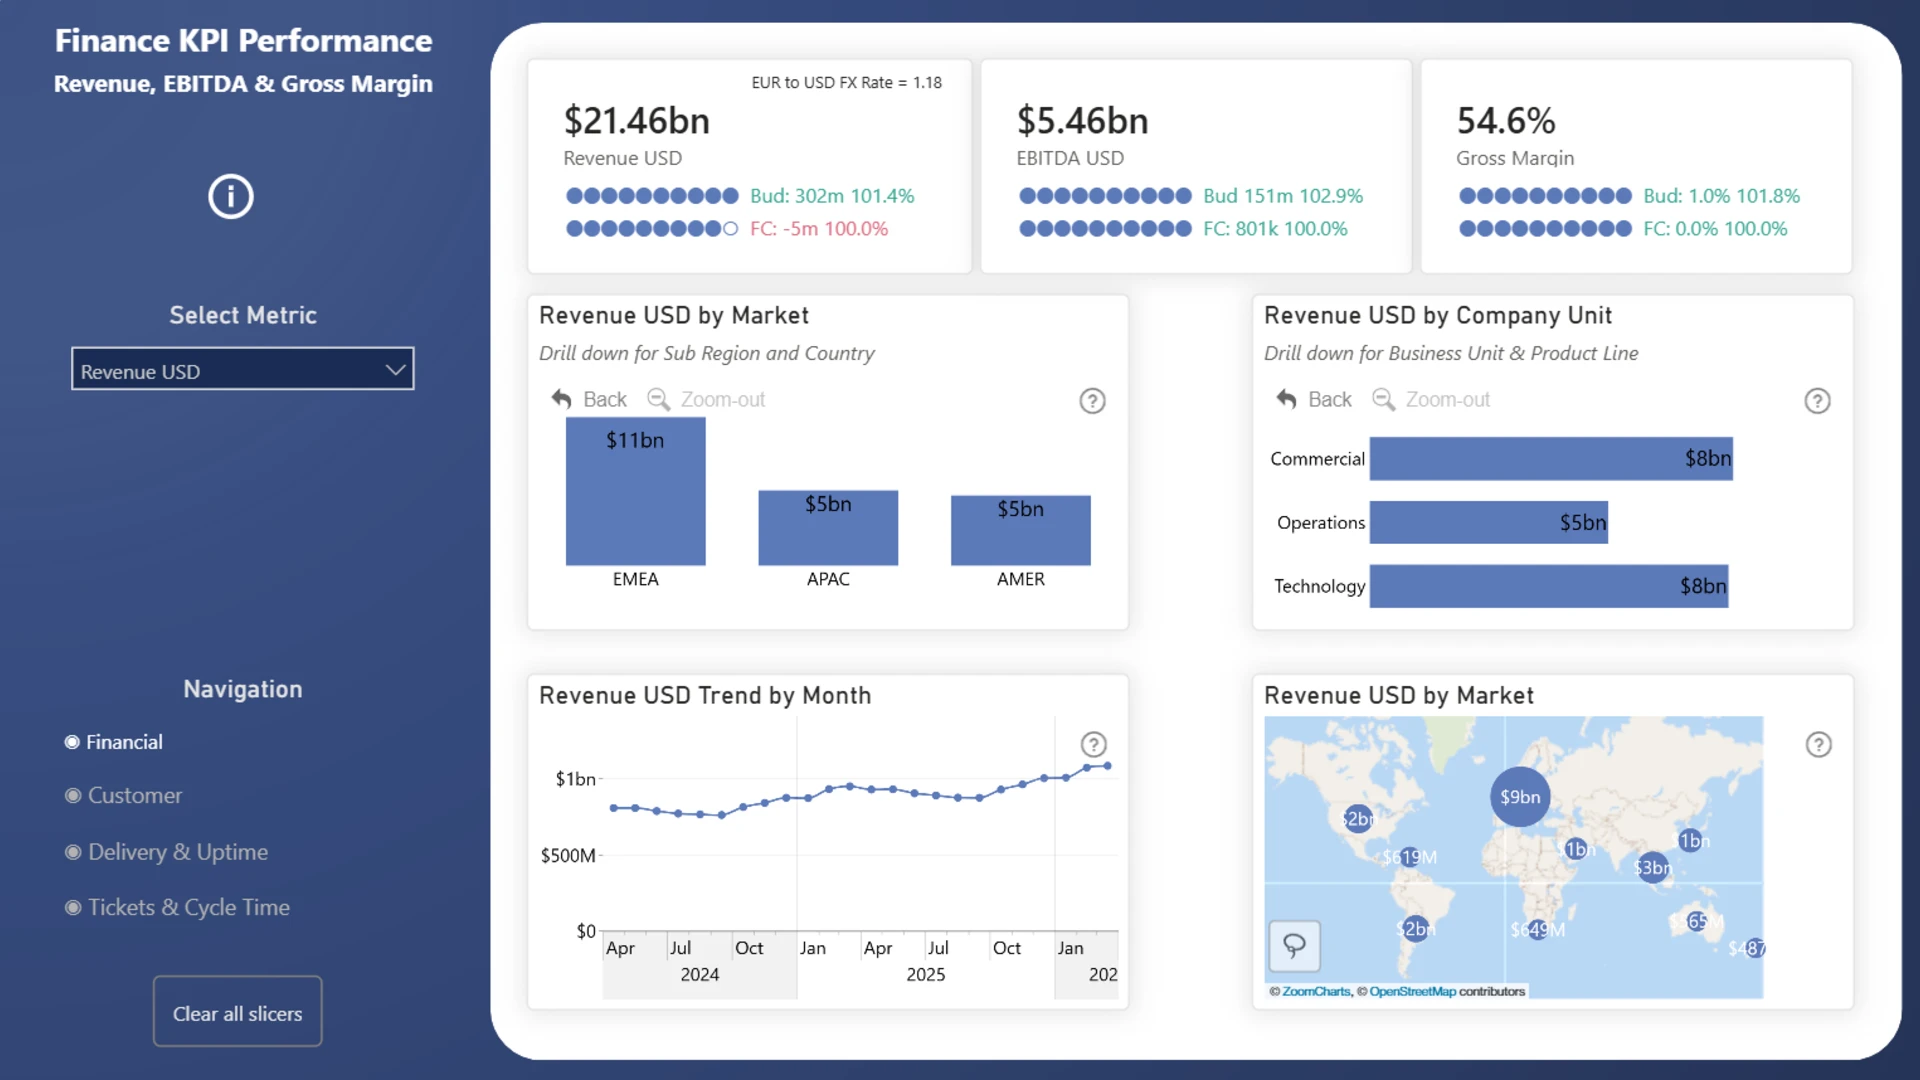
This interactive Power BI report presents an executive KPI dashboard built with ZoomCharts Drill Down custom visuals for Power BI. It highlights key metrics such as Revenue, EBITDA, Margin, Headcount, and Customer Growth, with Actual vs Budget vs Forecast comparisons, organizational drill-down, and regional performance analysis to support strategic decision-making.
The report was submitted to the ZoomCharts “4U Reports Challenge” (April 2026), using ZoomCharts Drill Down custom visuals for Power BI.
Author's Description:
Each section is designed with a uniform structure for senior executives, enabling them to quickly assess KPI status at a glance through consistent card visuals. This approach allows users to easily identify areas requiring attention and drill down into markets, business units, and products for deeper insights without reinterpreting different visuals. Due to this consistency, a single information pane on the first screen applies across all pages. The report relies on simple calculations - such as actual vs. budget/forecast, monthly totals, and variance - while the primary complexity lies in the filtering logic. A natural next step would be a more detailed version tailored for line managers, though that was outside the current scope.
ZoomCharts visuals used
Mobile view allows you to interact with the report. To Download the template please switch to desktop view.