logo
For Power BI
  • Products
    • Drill Down Donut Pro Drill Down Donut PRO
    • Drill Down Pie Pro Drill Down Pie PRO
    • Drill TimeSeries Pro Drill Down TimeSeries PRO
    • Drill Combo Pro Drill Down Combo PRO
    • Drill Map Pro Drill Down Map PRO
    • Drill Scatter Pro Drill Down Scatter PRO
    • Drill Down Network Pro Drill Down Network PRO
    • Drill Down Waterfall Pro Drill Down Waterfall PRO
    • Drill Down Graph Pro Drill Down Graph PRO
    • Drill Down Timeline Pro Drill Down Timeline PRO
    • Drill Down Combo Bar PRO Drill Down Combo Bar PRO

    Video tutorials

    Watch Now

    More than 90 videos on how to enhance Power BI with ZoomCharts

    Learn more
    All visuals
  • Resources

      Resources

    • Documentation
    • Report Examples
    • Blog
    • Webinars
    • Video Tutorials
    • Visuals Gallery

    Support

    • ZoomCharts Assistance
    • Contact Sales
    • Contact Support
    • FAQ

    Challenges

    Challenges

    Improve your report creation skills by participating in free challenges for report creators.

    Learn more
    Start trial
  • Services
    • Power BI Report Development
    • Custom Visual Development
  • Challenges
  • Pricing
Request a quote Start Free Book a Demo Sign in
Get it now
Go back

Contents

Go back

Demographics and Urbanization

Report Author: Misha Riaz

Report
Report Interact

Feel free to leave your vote:

4

Share template with others

Summary

Report submitted for Onyx Data DataDNA ZoomCharts Mini Challenge, February 2025. The report is based on the Demographic and Urbanization dataset and includes ZoomCharts custom Drill Down PRO visuals for Power BI. 

Authors Description 

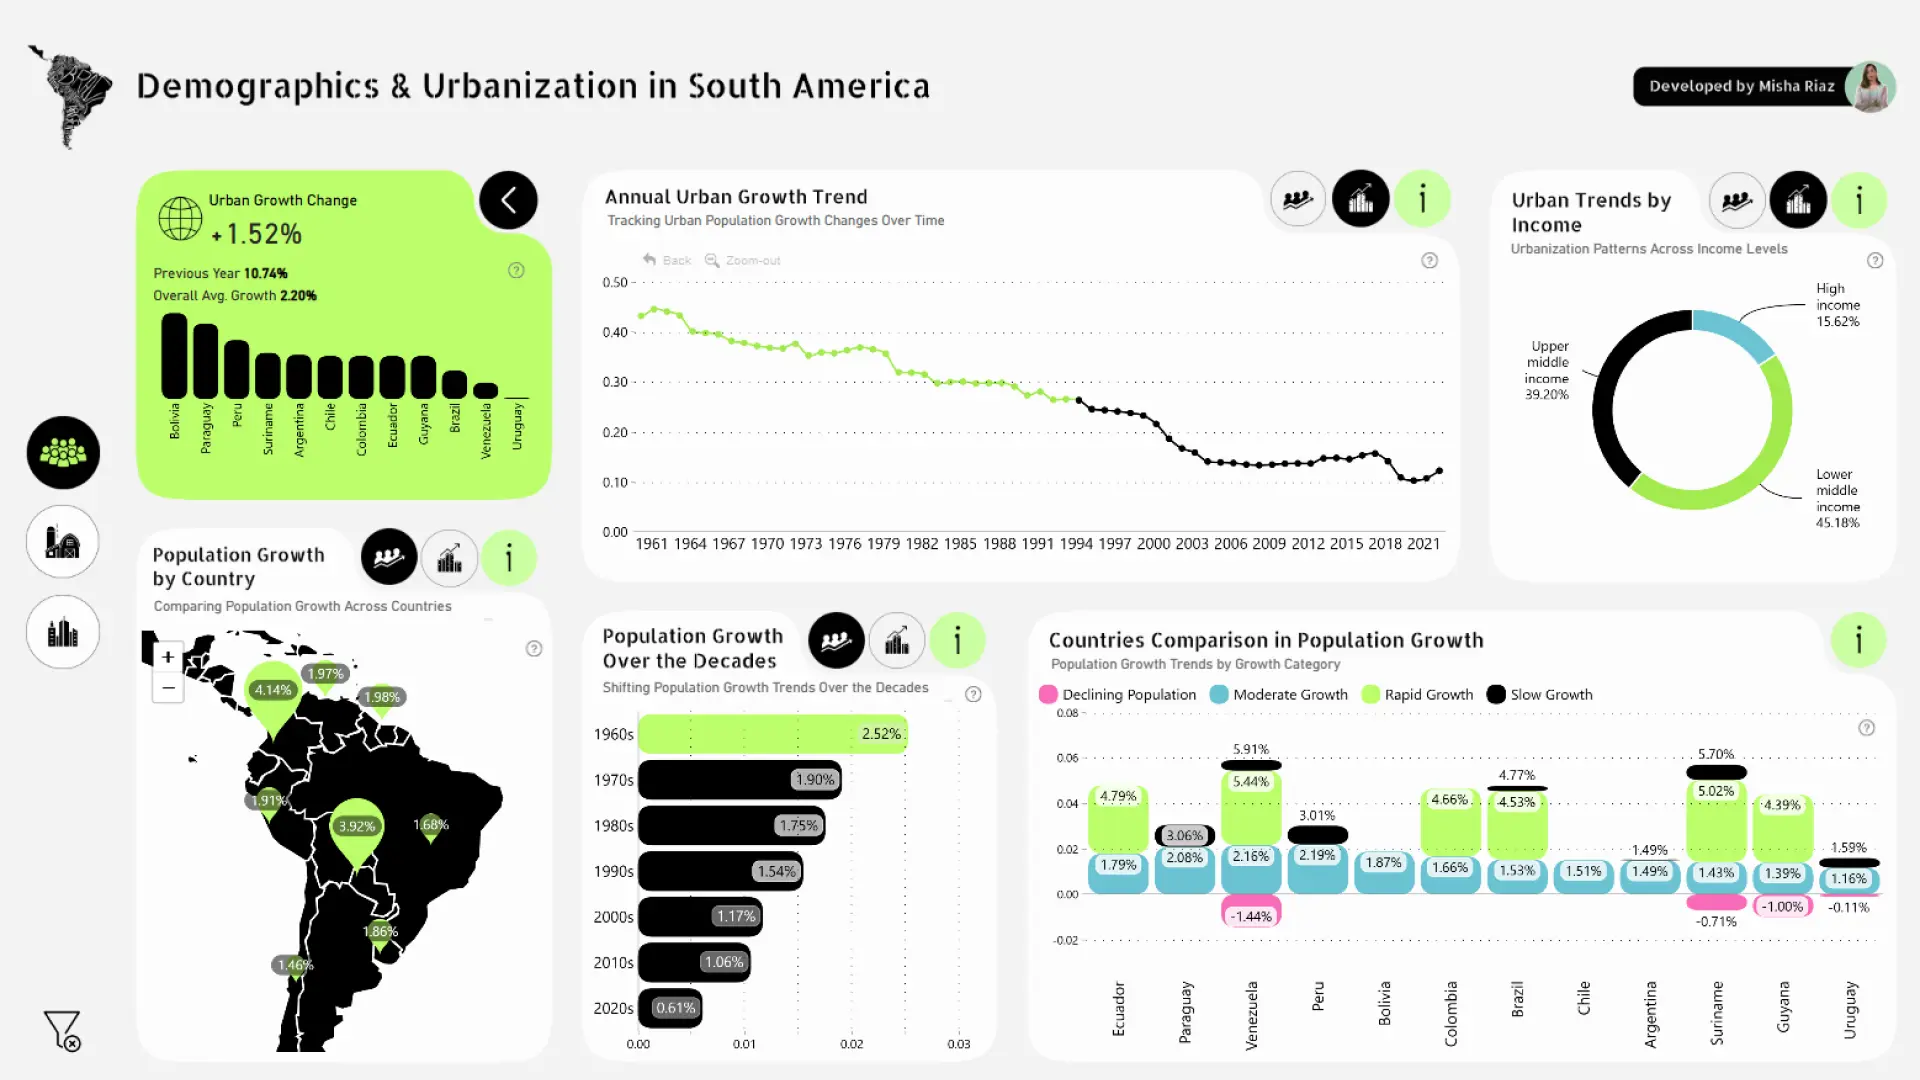
Urbanization & Demographic Shifts in South America: Key Insights
This analysis explores South America's population dynamics, focusing on urbanization trends, demographic shifts, and economic classifications. By leveraging historical data from 1960 to 2023, we examine how population growth, urban expansion, and unemployment rates vary across different countries, income groups, and time periods.

Key Areas of Analysis:
✅ Population Growth Trends

Tracking overall population growth across countries and time.
Identifying the fastest-growing nations and income groups with the highest/lowest growth.
Comparing historical growth rates across different decades (1960s, 1970s, etc.).
✅ Urbanization Patterns

Measuring urban vs. rural population shifts over time.
Analyzing which countries are urbanizing fastest and which have stagnant urban growth.
Exploring large city populations and their share of the total population.
✅ Economic & Income Group Comparisons

Examining how income levels impact population growth.
Determining whether high-income countries grow slower than middle/low-income ones.
Assessing whether middle-income countries experience higher urbanization rates.
✅ Unemployment & Socioeconomic Impact

Evaluating unemployment trends over the years.
Correlating employment rates with urban growth and economic categories.
Identifying countries with high unemployment despite urban expansion.

ZoomCharts visuals used

Drill Down Combo PRO Drill Down Combo PRO
Drill Down Combo Bar PRO Drill Down Combo Bar PRO
Drill Down Map PRO Drill Down Map PRO
Drill Down Donut PRO Drill Down Donut PRO

Mobile view allows you to interact with the report. To Download the template please switch to desktop view.

Try it in your Power BI!

New here? Fill up the form below and download!

Enjoy!

Success

Thank you for downloading the template!
We have sent a download link to your email.

For any questions, please contact us at ZoomCharts Assistance

Log in

Forgot password

Reset Password

Demographics and Urbanization

Share

Unfortunately this report file could not be downloaded. Please try again later.

You can contact support using chat or via email [email protected]

logo
[email protected]
+44 204 577 3993
logo

Products

Drill Down Network PRO Drill Down Waterfall PRO Drill Down Graph PRO Drill Down Combo PRO Drill Down Combo Bar PRO Drill Down Donut PRO Drill Down Pie PRO Drill Down TimeSeries PRO Drill Down Timeline PRO Drill Down Map PRO Drill Down Scatter PRO All Visuals

Resources

Report Examples Webinars Blog ZoomCharts Academy Visuals Gallery Documentation Custom Visual Development Subscribe to News

Solutions

Custom Visual Development

Company

Pricing About Us Partners Leave feedback Join PowerGroup EU Funding

Help

ZoomCharts Assistance Contact Sales Contact Support FAQ

Drill Down Network PRO Drill Down Waterfall PRO Drill Down Graph PRO Drill Down Combo PRO Drill Down Combo Bar PRO Drill Down Donut PRO Drill Down Pie PRO Drill Down TimeSeries PRO Drill Down Timeline PRO Drill Down Map PRO Drill Down Scatter PRO All Visuals

Report Examples Webinars Blog ZoomCharts Academy Visuals Gallery Documentation Custom Visual Development Subscribe to News

Custom Visual Development

Pricing About Us Partners Leave feedback Join PowerGroup EU Funding

ZoomCharts Assistance Contact Sales Contact Support FAQ
+44 204 577 3993
[email protected]

Ready to get in touch?

Contact our experts with any question about Power BI and ZoomCharts for Free!

Contact us

© 2025, Data Visualization Software Lab

U.S. Patents No. 11,645,343; 11,921,804

Cookies Policy
Manage cookies
Privacy Policy
Global
EULA
Patent
warning

Error message

success

Success info: Done!

ZoomCharts AI Assistant

We noticed you're using an old OS version.

For the best experience, we recommend upgrading to ensure that all website features display correctly.

Cookie settings

We use necessary cookies for site functionality, as well as statistic, marketing, and preference cookies to enhance your experience. For more information and to manage your preferences, please visit our Cookie policy