logo
For Power BI
  • Products
    • Drill Down Donut Pro Drill Down Donut PRO
    • Drill Down Pie Pro Drill Down Pie PRO
    • Drill TimeSeries Pro Drill Down TimeSeries PRO
    • Drill Combo Pro Drill Down Combo PRO
    • Drill Map Pro Drill Down Map PRO
    • Drill Scatter Pro Drill Down Scatter PRO
    • Drill Down Network Pro Drill Down Network PRO
    • Drill Down Waterfall Pro Drill Down Waterfall PRO
    • Drill Down Graph Pro Drill Down Graph PRO
    • Drill Down Timeline Pro Drill Down Timeline PRO
    • Drill Down Combo Bar PRO Drill Down Combo Bar PRO

    Video tutorials

    Watch Now

    More than 90 videos on how to enhance Power BI with ZoomCharts

    Learn more
    All visuals
  • Resources

      Resources

    • Documentation
    • Report Examples
    • Blog
    • Webinars
    • Video Tutorials
    • Visuals Gallery

    Support

    • ZoomCharts Assistance
    • Contact Sales
    • Contact Support
    • FAQ

    Challenges

    Challenges

    Improve your report creation skills by participating in free challenges for report creators.

    Learn more
    Start trial
  • Services
    • Power BI Report Development
    • Custom Visual Development
  • Challenges
  • Pricing
Request a quote Start Free Book a Demo Sign in
Get it now
Go back

Contents

Go back

FP20 Analytics Challenge 19

Report Author: Borys Kuznietsov

Report
Report Interact

Feel free to leave your vote:

0

Share template with others

Summary

Report submitted for FP20 Analytics ZoomCharts Challenge 19 (September 2024). The report was built with the E-commerce KPI Analysis dataset and includes ZoomCharts custom Drill Down PRO visuals for Power BI. 

Author's description:
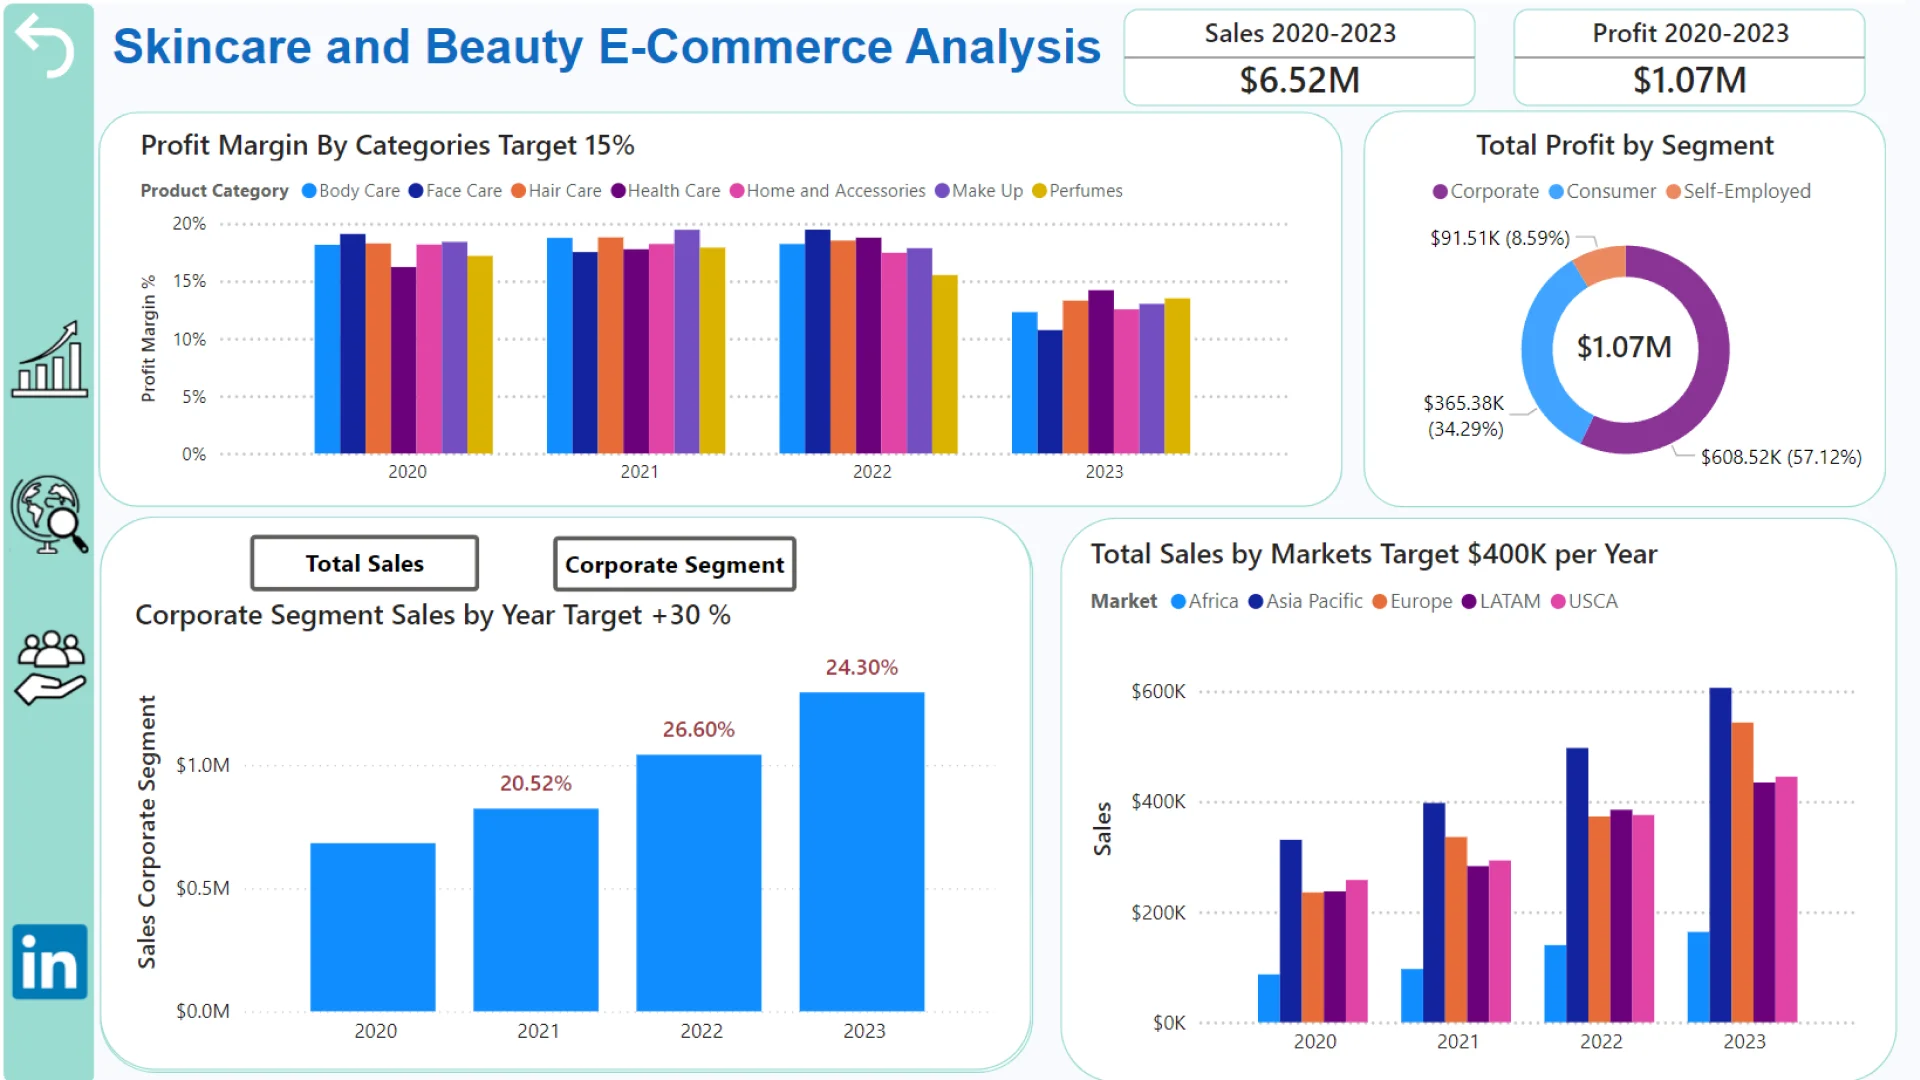
I conducted an analysis of the global skincare and beauty e-commerce sector, with an emphasis on essential performance metrics such as sales, profitability, and growth. Leveraging Power BI, I visualized data trends from 2020 to 2023 to identify valuable insights.

💡Why My Report Is Different!
I made it report close to real, because initial data contained inaccuracies in the distribution of products into categories and subcategories (like golden earrings in Body Care category!). So I have reorganized the products by keywords in the description using new conditional columns (Product Subcategory and Category). That's why my top sales categories and subcategories may differ from your reports. I also added 2 new category:
- Health Care (I added Vitamins to this category)
- Perfumes (Because Fragrances didn't suit to any of 5 existing categories)

👉 Key Insights:
🏷️Top-Performing Segments:
• Product Categories: Home and Accessories emerged as the most sold category, contributing 28% of total sales over the past three years.
• Corporate Segment: The corporate segment is 57% of total sales for the period.

🏷️Market Growth:
• Overall Sales: The e-commerce platform achieved more than targeted of 20% growth in sales yearly, but in corporate segment it wasn't able to reach the 30% goal.

🏷️Profit Distribution:
• Geographical Breakdown: Asia Pacific was the highest-earning region, generating $1.83 million in sales, which accounted for 28% of the total.
• Interactive Map: Explore regional profits and emerging markets using the interactive map by hashtag#ZoomCharts.

🏷️Best-Selling Products:
• Top Seller: The Herbal Essences Bio was the top-selling product, generating $67,6K in sales between 2020-2023.

ZoomCharts visuals used

Drill Down Donut PRO (Pin) Drill Down Donut PRO (Pin)
Drill Down Map PRO Drill Down Map PRO

Mobile view allows you to interact with the report. To Download the template please switch to desktop view.

Try it in your Power BI!

New here? Fill up the form below and download!

Enjoy!

Success

Thank you for downloading the template!
We have sent a download link to your email.

For any questions, please contact us at ZoomCharts Assistance

Log in

Forgot password

Reset Password

FP20 Analytics Challenge 19

Share

Unfortunately this report file could not be downloaded. Please try again later.

You can contact support using chat or via email [email protected]

logo
[email protected]
+44 204 577 3993
logo

Products

Drill Down Network PRO Drill Down Waterfall PRO Drill Down Graph PRO Drill Down Combo PRO Drill Down Combo Bar PRO Drill Down Donut PRO Drill Down Pie PRO Drill Down TimeSeries PRO Drill Down Timeline PRO Drill Down Map PRO Drill Down Scatter PRO All Visuals

Resources

Report Examples Webinars Blog ZoomCharts Academy Visuals Gallery Documentation Custom Visual Development Subscribe to News

Solutions

Custom Visual Development

Company

Pricing About Us Partners Leave feedback Join PowerGroup EU Funding

Help

ZoomCharts Assistance Contact Sales Contact Support FAQ

Drill Down Network PRO Drill Down Waterfall PRO Drill Down Graph PRO Drill Down Combo PRO Drill Down Combo Bar PRO Drill Down Donut PRO Drill Down Pie PRO Drill Down TimeSeries PRO Drill Down Timeline PRO Drill Down Map PRO Drill Down Scatter PRO All Visuals

Report Examples Webinars Blog ZoomCharts Academy Visuals Gallery Documentation Custom Visual Development Subscribe to News

Custom Visual Development

Pricing About Us Partners Leave feedback Join PowerGroup EU Funding

ZoomCharts Assistance Contact Sales Contact Support FAQ
+44 204 577 3993
[email protected]

Ready to get in touch?

Contact our experts with any question about Power BI and ZoomCharts for Free!

Contact us

© 2025, Data Visualization Software Lab

U.S. Patents No. 11,645,343; 11,921,804

Cookies Policy
Manage cookies
Privacy Policy
Global
EULA
Patent
warning

Error message

success

Success info: Done!

ZoomCharts AI Assistant

We noticed you're using an old OS version.

For the best experience, we recommend upgrading to ensure that all website features display correctly.

Cookie settings

We use necessary cookies for site functionality, as well as statistic, marketing, and preference cookies to enhance your experience. For more information and to manage your preferences, please visit our Cookie policy