logo
For Power BI
  • Products
    • Drill Down Donut Pro Drill Down Donut PRO
    • Drill Down Pie Pro Drill Down Pie PRO
    • Drill TimeSeries Pro Drill Down TimeSeries PRO
    • Drill Combo Pro Drill Down Combo PRO
    • Drill Map Pro Drill Down Map PRO
    • Drill Scatter Pro Drill Down Scatter PRO
    • Drill Down Network Pro Drill Down Network PRO
    • Drill Down Waterfall Pro Drill Down Waterfall PRO
    • Drill Down Graph Pro Drill Down Graph PRO
    • Drill Down Timeline Pro Drill Down Timeline PRO
    • Drill Down Combo Bar PRO Drill Down Combo Bar PRO

    Video tutorials

    Watch Now

    More than 90 videos on how to enhance Power BI with ZoomCharts

    Learn more
    All visuals
  • Resources

      Resources

    • Documentation
    • Report Examples
    • Blog
    • Webinars
    • Video Tutorials
    • Visuals Gallery

    Support

    • ZoomCharts Assistance
    • Contact Sales
    • Contact Support
    • FAQ

    Challenges

    Challenges

    Improve your report creation skills by participating in free challenges for report creators.

    Learn more
    Start trial
  • Services
    • Power BI Report Development
    • Custom Visual Development
  • Challenges
  • Pricing
Request a quote Start Free Book a Demo Sign in
Get it now
Go back

Contents

Go back

Marketing Campaign Analysis Dashboard

Report Author: Gokul Karthik

Report
Report Interact

Feel free to leave your vote:

4

Share template with others

Summary

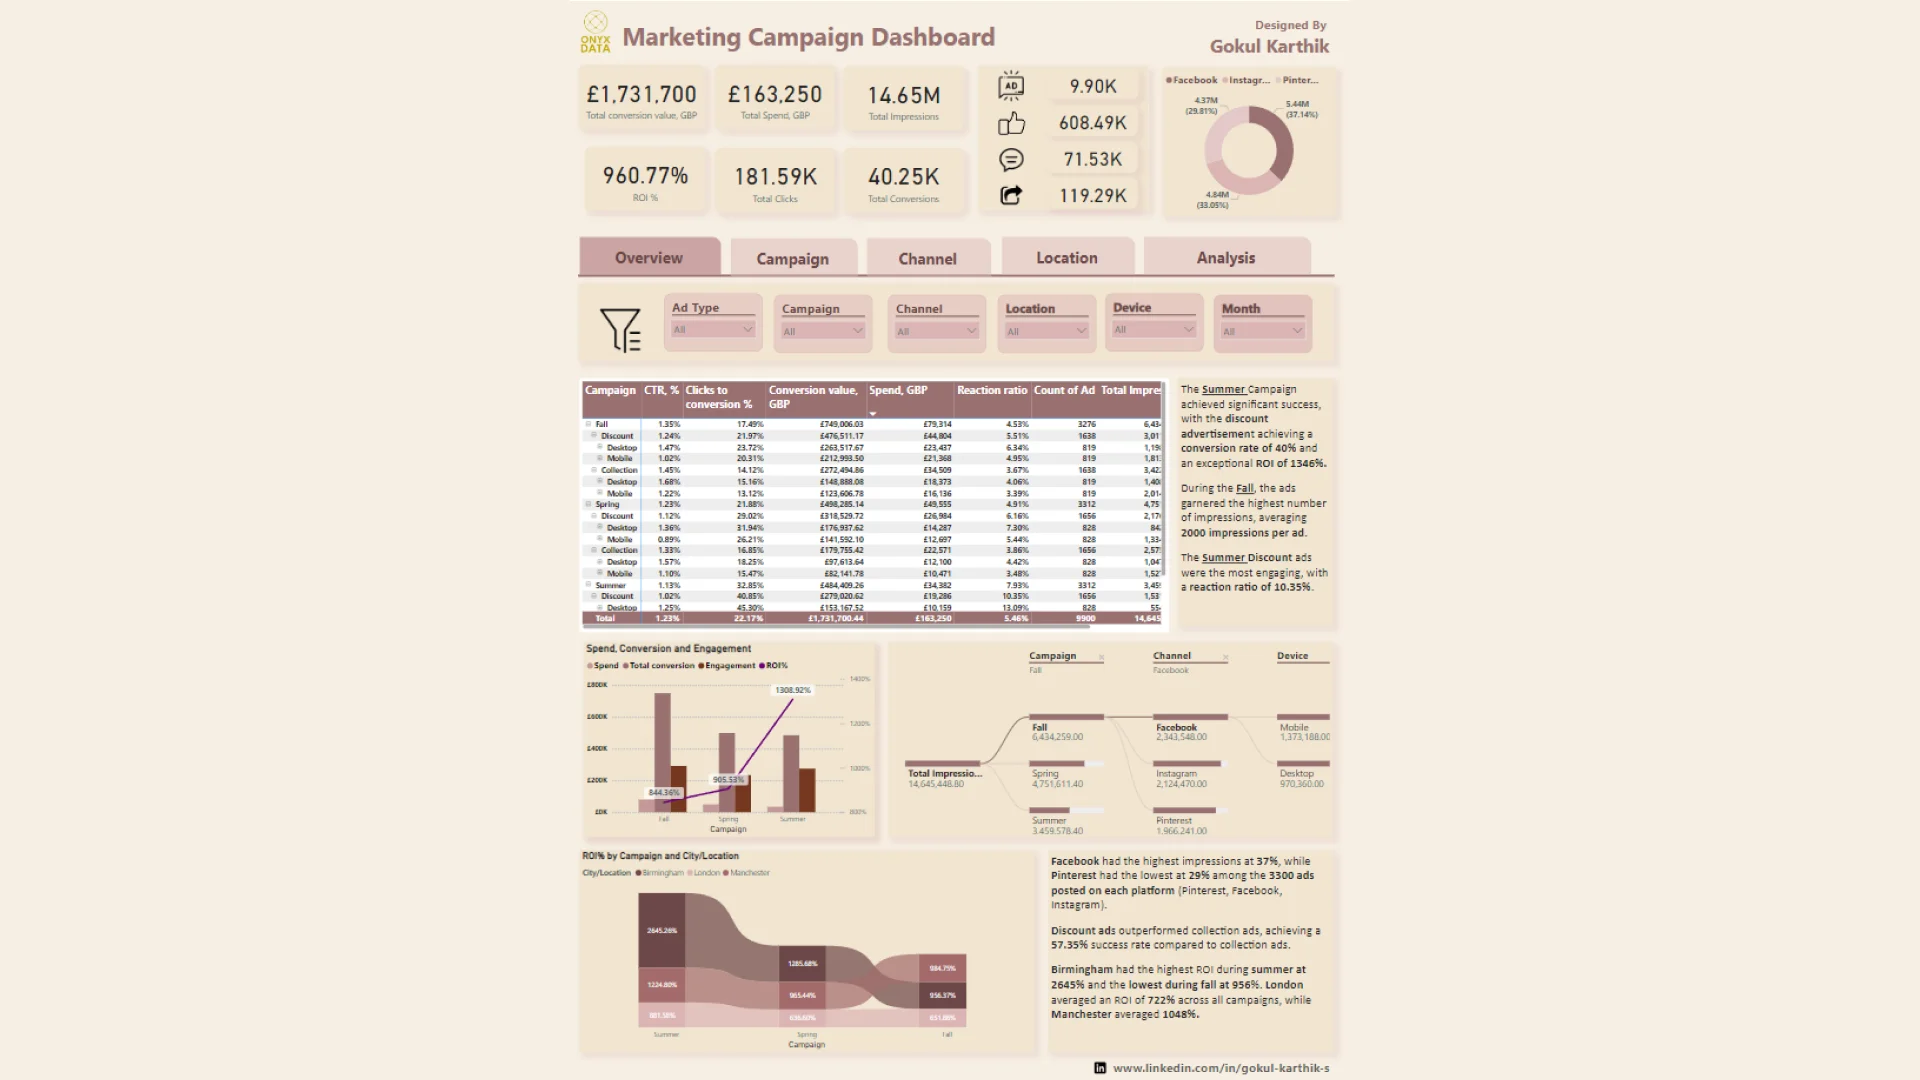
Report submitted for OnyxData #DataDNA and ZoomCharts Challenge June 2024. The report was built with the Marketing Campaing Dataset and includes ZoomCharts custom Drill Down PRO visuals for Power BI.

Author's description:

Our recent data analysis reveals that the Fall campaign outperformed the Spring and Summer campaigns across several key metrics. The Fall campaign generated the highest number of impressions (6.4M), clicks (85K), and conversions (15K). Additionally, it maintained a higher CTR over time compared to the other campaigns, peaking at 0.519. This indicates that the strategies employed during the Fall campaign were particularly effective in engaging the audience and driving conversions.

Campaign Comparison:

  • Spring Campaign: Achieved lower impressions and clicks compared to Fall but significant conversions (13K), indicating efficient conversion strategies despite lower engagement.
  • Summer Campaign: Had the lowest impressions and clicks but similar conversion numbers to Spring, suggesting opportunities for improvement in both engagement and conversion rates.

Recommendations for Future Campaigns:

  1. Replicate Successful Fall Campaign Strategies: Implement successful Fall campaign strategies (content, timing, targeting, channels) across other seasons to potentially increase key metrics by up to 20%.

  2. Optimize Conversion Strategies: Review and refine Spring and Summer campaign conversion methods to boost conversion rates by 15-25%.

  3. Reallocate Budget: Focus budget on high-performing Fall campaign strategies, potentially increasing total conversion value by £173,000.

  4. Focus on High CTR Periods: Emphasize periods with high CTR from the Fall campaign to improve engagement by 10-15% in future campaigns.

  5. Invest in High-Performing Platforms: Increase investment in Facebook with a high conversion rate of 38.73%. A 10% increase in budget allocation could yield an additional 387% in conversions. For Instagram and Pinterest, analyze and improve content and engagement strategies to potentially increase conversions by 5-10%.

  6. Boost Engagement Metrics: Replicate high engagement strategies from the Fall and Summer campaigns to increase likes, shares, and comments by 10-15%. Optimize Spring campaign content and engagement to enhance interaction metrics by 20%.

  7. Leverage Geographical Insights: Target high-performing cities (e.g., Manchester, Birmingham, London) with localized campaigns to enhance engagement metrics by 15%.

By following these recommendations, we can significantly enhance the performance of our marketing campaigns, driving better engagement and conversion rates. 🚀

ZoomCharts visuals used

Drill Down Combo PRO Drill Down Combo PRO
Drill Down Pie PRO Drill Down Pie PRO

Mobile view allows you to interact with the report. To Download the template please switch to desktop view.

Try it in your Power BI!

New here? Fill up the form below and download!

Enjoy!

Success

Thank you for downloading the template!
We have sent a download link to your email.

For any questions, please contact us at ZoomCharts Assistance

Log in

Forgot password

Reset Password

Marketing Campaign Analysis Dashboard

Share

Unfortunately this report file could not be downloaded. Please try again later.

You can contact support using chat or via email [email protected]

logo
[email protected]
+44 204 577 3993
logo

Products

Drill Down Network PRO Drill Down Waterfall PRO Drill Down Graph PRO Drill Down Combo PRO Drill Down Combo Bar PRO Drill Down Donut PRO Drill Down Pie PRO Drill Down TimeSeries PRO Drill Down Timeline PRO Drill Down Map PRO Drill Down Scatter PRO All Visuals

Resources

Report Examples Webinars Blog ZoomCharts Academy Visuals Gallery Documentation Custom Visual Development Subscribe to News

Solutions

Custom Visual Development

Company

Pricing About Us Partners Leave feedback Join PowerGroup EU Funding

Help

ZoomCharts Assistance Contact Sales Contact Support FAQ

Drill Down Network PRO Drill Down Waterfall PRO Drill Down Graph PRO Drill Down Combo PRO Drill Down Combo Bar PRO Drill Down Donut PRO Drill Down Pie PRO Drill Down TimeSeries PRO Drill Down Timeline PRO Drill Down Map PRO Drill Down Scatter PRO All Visuals

Report Examples Webinars Blog ZoomCharts Academy Visuals Gallery Documentation Custom Visual Development Subscribe to News

Custom Visual Development

Pricing About Us Partners Leave feedback Join PowerGroup EU Funding

ZoomCharts Assistance Contact Sales Contact Support FAQ
+44 204 577 3993
[email protected]

Ready to get in touch?

Contact our experts with any question about Power BI and ZoomCharts for Free!

Contact us

© 2025, Data Visualization Software Lab

U.S. Patents No. 11,645,343; 11,921,804

Cookies Policy
Manage cookies
Privacy Policy
Global
EULA
Patent
warning

Error message

success

Success info: Done!

ZoomCharts AI Assistant

We noticed you're using an old OS version.

For the best experience, we recommend upgrading to ensure that all website features display correctly.

Cookie settings

We use necessary cookies for site functionality, as well as statistic, marketing, and preference cookies to enhance your experience. For more information and to manage your preferences, please visit our Cookie policy