logo
For Power BI
  • Products
    • Drill Down Donut Pro Drill Down Donut PRO
    • Drill Down Pie Pro Drill Down Pie PRO
    • Drill TimeSeries Pro Drill Down TimeSeries PRO
    • Drill Combo Pro Drill Down Combo PRO
    • Drill Map Pro Drill Down Map PRO
    • Drill Scatter Pro Drill Down Scatter PRO
    • Drill Down Network Pro Drill Down Network PRO
    • Drill Down Waterfall Pro Drill Down Waterfall PRO
    • Drill Down Graph Pro Drill Down Graph PRO
    • Drill Down Timeline Pro Drill Down Timeline PRO
    • Drill Down Combo Bar PRO Drill Down Combo Bar PRO

    Video tutorials

    Watch Now

    More than 90 videos on how to enhance Power BI with ZoomCharts

    Learn more
    All visuals
  • Resources

      Resources

    • Documentation
    • Report Examples
    • Blog
    • Webinars
    • Video Tutorials
    • Visuals Gallery

    Support

    • ZoomCharts Assistance
    • Contact Sales
    • Contact Support
    • FAQ

    Challenges

    Challenges

    Improve your report creation skills by participating in free challenges for report creators.

    Learn more
    Start trial
  • Services
    • Power BI Report Development
    • Custom Visual Development
  • Challenges
  • Pricing
Request a quote Start Free Book a Demo Sign in
Get it now
Go back

Contents

Go back

Share

Logo

Welcome to the Onyx Data April 2025 Challenge!

Mar 31 - Apr 30, 2025 | EDT

Join a healthcare analysis challenge - work with simulated patient data to uncover insights in healthcare management, treatment trends, and hospital performance.

Timeline

Registration Open

Registration Open

31 March | 19:00

-

Submissions Open

Submissions Open

31 March | 19:00

-

Workshop | Power BI for Healthcare – Unlocking Insights from Patient Data

Workshop | Power BI for Healthcare – Unlocking Insights from Patient Data

08 April | 08:00

-

1:1 Mentoring Sessions

1:1 Mentoring Sessions

08 April | 08:00

31 March - 24 April

Entry Submission Deadline

Entry Submission Deadline

24 April | 20:00

31 March - 24 April

Winner Announced

Winner Announced

30 April | 06:00

31 March - 24 April

Webinar | Top 5 Power BI Dashboards for Healthcare Analysis

Webinar | Top 5 Power BI Dashboards for Healthcare Analysis

30 April | 07:00

31 March - 24 April

Dataset

Get the dataset

See past Onyx Data challenges

See past challenges

Share the challenge

Submitted Reports
About challenge
How to participate
The Brief
Judging criteria
Timeline
Dataset
Past challenges

Winner of the challenge

Report Card

National Health Analysis

Author: Okeh Dono Efasa

49

View Report

All Submissions

Report Card

Onyx Data challenge April 2025

Author: Ayushi Dadhich

0

View Report
Report Card

Onyx Data Healthcase Analysis

Author: Faraz Ali Khan Niazi

0

View Report
Report Card

Health Analysis Dashboard

Author: Darwin Obeal

1

View Report
Report Card

Crystal_Healthcare_DB_APR25

Author: Crystal Andrea Dsouza

9

View Report
Report Card

Healthcare Analysis

Author: Gamal Mahmoud

0

View Report
Report Card

Healthcare report

Author: Houssam Damerji

0

View Report
Report Card

Onyx_Data_ChallengeHealthcare

Author: Swaroopa Mummadi

0

View Report
Report Card

Health Care Analysis Dashboard

Author: Olukayode Akintola-Peters

1

View Report
Report Card

Healthcare analysis

Author: Azeez Olaribigbe

1

View Report
Report Card

Healthcare Analysis

Author: Shubhangi Bidkar

0

View Report
Report Card

United States Healthcare Analysis

Author: Nagalakshmi Manne

0

View Report
Report Card

Healath Care Dataset Report (April-2025)

Author: Kyawmoewaingp Wai

0

View Report
Report Card

Healthcare Analysis

Author: Surekha Berlin

1

View Report
Report Card

US Healthcare Analysis 2019-2024

Author: Rupali Barhate

2

View Report
Report Card

HealthCare Analysis Challenge April 2025

Author: Garima Srivastava

0

View Report
Report Card

Healthcare Analysis

Author: JAHID HOSSAN

0

View Report
Report Card

Blood Type Segmentation Report

Author: Adewole Oyediran

0

View Report
Report Card

HealthCare Analysis

Author: Faith Ojile

0

View Report
Report Card

Health Care Analysis

Author: Akashdeep Dam

0

View Report
Report Card

Onyx DNA Healthcare Pulse

Author: Khushbu Yagik

1

View Report
Report Card

Hospital Medical Data

Author: Gori Omotola

0

View Report
Report Card

ZoomNyx Medika Healthcare Analysis

Author: Ifeoma Ogbodo

1

View Report
Report Card

Healthcare Analysis Dashboard

Author: Mohammed Mirzan

1

View Report
Report Card

U.S. Healthcare: Insights in Care, Cost, and Coverage

Author: Vanessa Florez

0

View Report
Report Card

Onyx DNA Healthcare Pulse

Author: KHUSHBU YAGIK

1

View Report
Report Card

SmartHealthcare

Author: Prolet Hristova

0

View Report
Report Card

PulseCheck – Patient Insight Dashboard

Author: Surjeetsinh Thakur

0

View Report
Report Card

Healthcare-Analysis

Author: Iyabo Sindiku

0

View Report
Report Card

US Healthcare Analysis

Author: Suparna Chowdhury

1

View Report
Report Card

Healthcare Analysis

Author: Kanchan Kulkarni

0

View Report
Report Card

Healthcare Dataset

Author: Casey Condran

0

View Report
Report Card

April Onyx data challenge report

Author: Adediran Adeyemi

0

View Report
Report Card

Onyx healthcare report

Author: Abigail Adeleye

0

View Report
Report Card

Onyx_Data_April_2025_W_Paziewski

Author: Wojciech Paziewski

1

View Report
Report Card

Hospital Healthcare Report

Author: Ozoka Chinecherem

1

View Report
Report Card

Vubwi Health Analytica: Healthcare insights across 10 Hospitals

Author: Daniel Banda

0

View Report
Report Card

Health Care Analysis

Author: Prosper Onyenkwere

0

View Report
Report Card

Obinna Uzo Onyx Data Challenge

Author: Obinna Uzo

0

View Report
Report Card

Devendra_singh_Rajawat_OYNX_April_2025

Author: Devendra Rajawat

0

View Report
Report Card

Eboh Chidera ONYX Data Challenge

Author: Chidera Eboh

0

View Report
Report Card

Apr 2025 DataDNA Healthcare Dashboard

Author: Sneha Srinath

0

View Report
Report Card

Challenge

Author: Kaviya S

1

View Report
Report Card

360° HEALTHCARE INTELLIGENCE DASHBOARD

Author: Sanskriti Kashyap

4

View Report
Report Card

Hospital Dashboard 2

Author: Gyanankur Baruah

0

View Report
Report Card

Sapna Taneja

Author: Sapana Sapana

1

View Report
Report Card

Healthcare Overview

Author: Rakshit Bhadoria

1

View Report
Report Card

Health Care Data Analysis

Author: Magudeswaran M

1

View Report
Report Card

Healthcare Dashboard

Author: Ekom-obong Essien

0

View Report
Report Card

Regina onyx data challenge

Author: Regina Onuoha

1

View Report
Report Card

Healthcare Management Analysis

Author: BIDEMI SAKA

0

View Report
Report Card

Healthcare Dashboard

Author: Aquib Ahsan

0

View Report
Report Card

Healthcare Data Analysis Report

Author: Hugo Lopes

0

View Report
Report Card

Health care data analysis

Author: Nur Widiyanti

0

View Report
Report Card

Healthcare Analysis

Author: Joyvine Namaemba

0

View Report
Report Card

Onyx Data - DataDNA Dataset Challenge - Healthcare Dataset - April 2025

Author: Juan Martinez

0

View Report
Report Card

Healthcare Analysis April Challenge - Ayuba

Author: Ayuba Ahmed Bayugo

0

View Report
Report Card

Healthcare Analysis

Author: Ogungbile Marvelous

0

View Report
Report Card

Onyx Healthcare analysis Data Challenge

Author: SAI KEERTHANA DACHEPALLY

0

View Report
Report Card

Healthcare Insights: Patient Admissions & Treatment Analysis

Author: Nacer Aderdour

1

View Report
Report Card

USA Hospital Demography

Author: Mamata Manjari Sahoo

0

View Report
Report Card

US Healthcare Analysis

Author: Yashraj Singh

5

View Report
Report Card

U.S. Healthcare Analysis

Author: Siddesh Pardeshi

0

View Report
Report Card

Healthcare Analysis

Author: Senthamilarasu V M

1

View Report
Report Card

Christopher Sabiti

Author: Christopher Sabiti

1

View Report
Report Card

MariaDiaz_OnyxData_HealthcareAnalysis

Author: Maria Diaz

0

View Report
Report Card

Healthcare Analysis

Author: Shruthi Kolan

0

View Report
Report Card

Healthcare Analysis

Author: da9c407c Power BI

1

View Report
Report Card

Healthcare Analysis

Author: Mihaela Parvu

0

View Report
Report Card

Healthcare Data Analysis

Author: Mary Rose Felizardo

0

View Report
Report Card

Tunzala

Author: Tunzala Allahverdiyeva

0

View Report
Report Card

Health Care Analysis

Author: Praveen Barange

0

View Report
Report Card

HealthCare Analysis

Author: Joao Souza, Alessa Araujo

1

View Report
Report Card

Health Challenge

Author: Steven Stanford

0

View Report
Report Card

Onyx Health

Author: Rahul Chundawat

9

View Report
Report Card

Aanu Akinola

Author: Aanu Akinola

0

View Report
Report Card

Uncovering Healthcare Insights: April 2025 DataDNA ZoomCharts Mini Challenge Report

Author: Joshua Egberibo

93

View Report
Report Card

Healthcare Analysis Dashboard

Author: Taha Ali Ansari

0

View Report
Report Card

Healthcare Analysis

Author: Alessa Araujo

0

View Report
Report Card

Healthcare Analysis

Author: Anthonia Uche Okafor

0

View Report
Report Card

HealthCare

Author: Emna Toumi

0

View Report
Report Card

Healthcare Analysis

Author: Yew Kok Tang

2

View Report
Report Card

Healthcare Analysis

Author: Sampath Kumar K

0

View Report
Report Card

Healthcare Analysis

Author: Shreya Dutta

0

View Report
Report Card

Healthcare Analysis

Author: Salagrama Sri Venkateswarlu

0

View Report
Report Card

Healthcare Analysis

Author: Vallapaneni Chandrasekhar

1

View Report
Report Card

Healthcare Analysis

Author: Noureddine Yachou

1

View Report
Report Card

Onyx Data Challenge - US Healthcare Analytics Dashboard

Author: Pherzy John Diez

30

View Report
Report Card

Healthcare Analysis

Author: Agbata Dickson Ukolojo

26

View Report
Report Card

Healthcare

Author: Andreas Miftakhul Pratama

14

View Report
Report Card

Healthcare Analysis

Author: Akhilesh Raut

14

View Report
Report Card

Healthcare Analysis Report

Author: Mohammed Afzal Shariff

8

View Report

About ZoomCharts Mini Challenge

ZoomCharts Mini Challenge is part of the global DataDNA – Dataset Challenge by Onyx Data, which unites 25K+ data enthusiasts worldwide, ranging from beginners to seasoned professionals, including Microsoft MVPs. Read more about the DataDNA challenge on the Onyx Data website. Join the community on LinkedIn

The ZoomCharts Mini Challenge provides a platform for a growing community to learn how to build PRO reports, aiding business users to explore data quickly and intuitively.

  1. Free License: All participants receive a free ZoomCharts Developer License that gives access to the full Drill Down PRO visuals library. License will remain active for 1 year after the challenge.
  2. Learn from Experienced Professionals: As part of the challenge, we host live workshops on report building and visualizing the challenge’s dataset in Power BI. Challenge participants can also book an individual consultation with an experienced Power BI mentor to ask questions and get personalized tips.
  3. Tailored Feedback: Every challenge submission will receive personalized feedback, giving participants the chance to hone their skills and improve their reports.

Prizes

The best report’s creator will receive a $300 Amazon gift card from ZoomCharts.

Webinar recordings

Recording thumbnail

Power BI for Healthcare – Unlocking Insights from Patient Data

Explore top healthcare data visualization practices – what works, what doesn’t. Discover proven techniques and actionable insights to better understand patient trends, treatment costs, and hospital performance!

Watch the recording
Recording thumbnail

Top 5 Power BI Dashboards for Healthcare Analysis

Explore the most impactful Power BI dashboards in healthcare analytics! Join us as we dive into this month’s Top 5 submissions, featuring dashboards that analyze patient demographics, medical conditions, costs, and outcomes across major hospitals.

Watch the recording

How to participate? 

1. Register for the challenge: 

  • Download the DataDNA Challenge dataset either on this Challenge page or from Onyx Data website. 
  • Register for DataDNA ZoomCharts Mini Challenge.
  • Activate your free Drill Down Visuals Developer License for Power BI. Read license setup instructions.

2. Build your report in Power BI: 

  • Set up an account in Power BI using the assigned license details (if you have participated in ZoomCharts Challenges in the past, you can use the same account you set up before).
  • Use the account to access the full library of custom ZoomCharts Drill Down visuals. 
  • Use the dataset to build a Power BI report including at least 2 ZoomCharts Drill Down Visuals in one report page. 

3. Improve your report and learn new skills: 

  • To learn more about applying ZoomCharts visuals in your reports, participate in the challenge workshop. 
  • If you have any questions or need advice, you can book a free individual consultation here.
  • Check out the submissions from past challenges for inspiration. 

4. Submit your challenge entry: 

  • Submit your report in .pbix format for validation. 
  • If your submission doesn’t match the challenge criteria, you will be notified by email indicating the reason. Don't worry if this happens! You can fix the issue and resubmit your report. 
  • Together with validation confirmation you will receive a publish to web link that you can use to add the report to your portfolio or publicly share online. 
  • All validated entries will receive personalized feedback from the evaluation team. You can use this feedback to revise your report and resubmit it before the deadline. Feel free to resubmit your entry as many times as necessary before the deadline. 

5. Finalize your participation to compete for the prize: 

  • Post the final version of your submission as a single image on your LinkedIn profile, including the tags @ZoomCharts and @OnyxData, as well as the hashtags #dataDNA and #builtwithzoomcharts.
  • After posting the report on LinkedIn, please complete this form.
  • Follow ZoomCharts on LinkedIn 
  • Follow Onyx Data on LinkedIn 
  • All participants of ZoomCharts Mini Challenge who have filled in the form are also valid to compete in the main Onyx Data DataDNA challenge for a chance to win additional prizes. Read more here. 

6. Attend challenge closing webinar to hear the results: 

  • The submissions are evaluated by ZoomCharts team (see "Judging criteria" for more info). The submissions of Top 5 ZoomCharts Mini Challenge finalists are analyzed live during the challenge closing webinar to share the best practices and learning opportunities with the community.
  • The author of the best report is rewarded with a $300 Amazon gift card from ZoomCharts. 

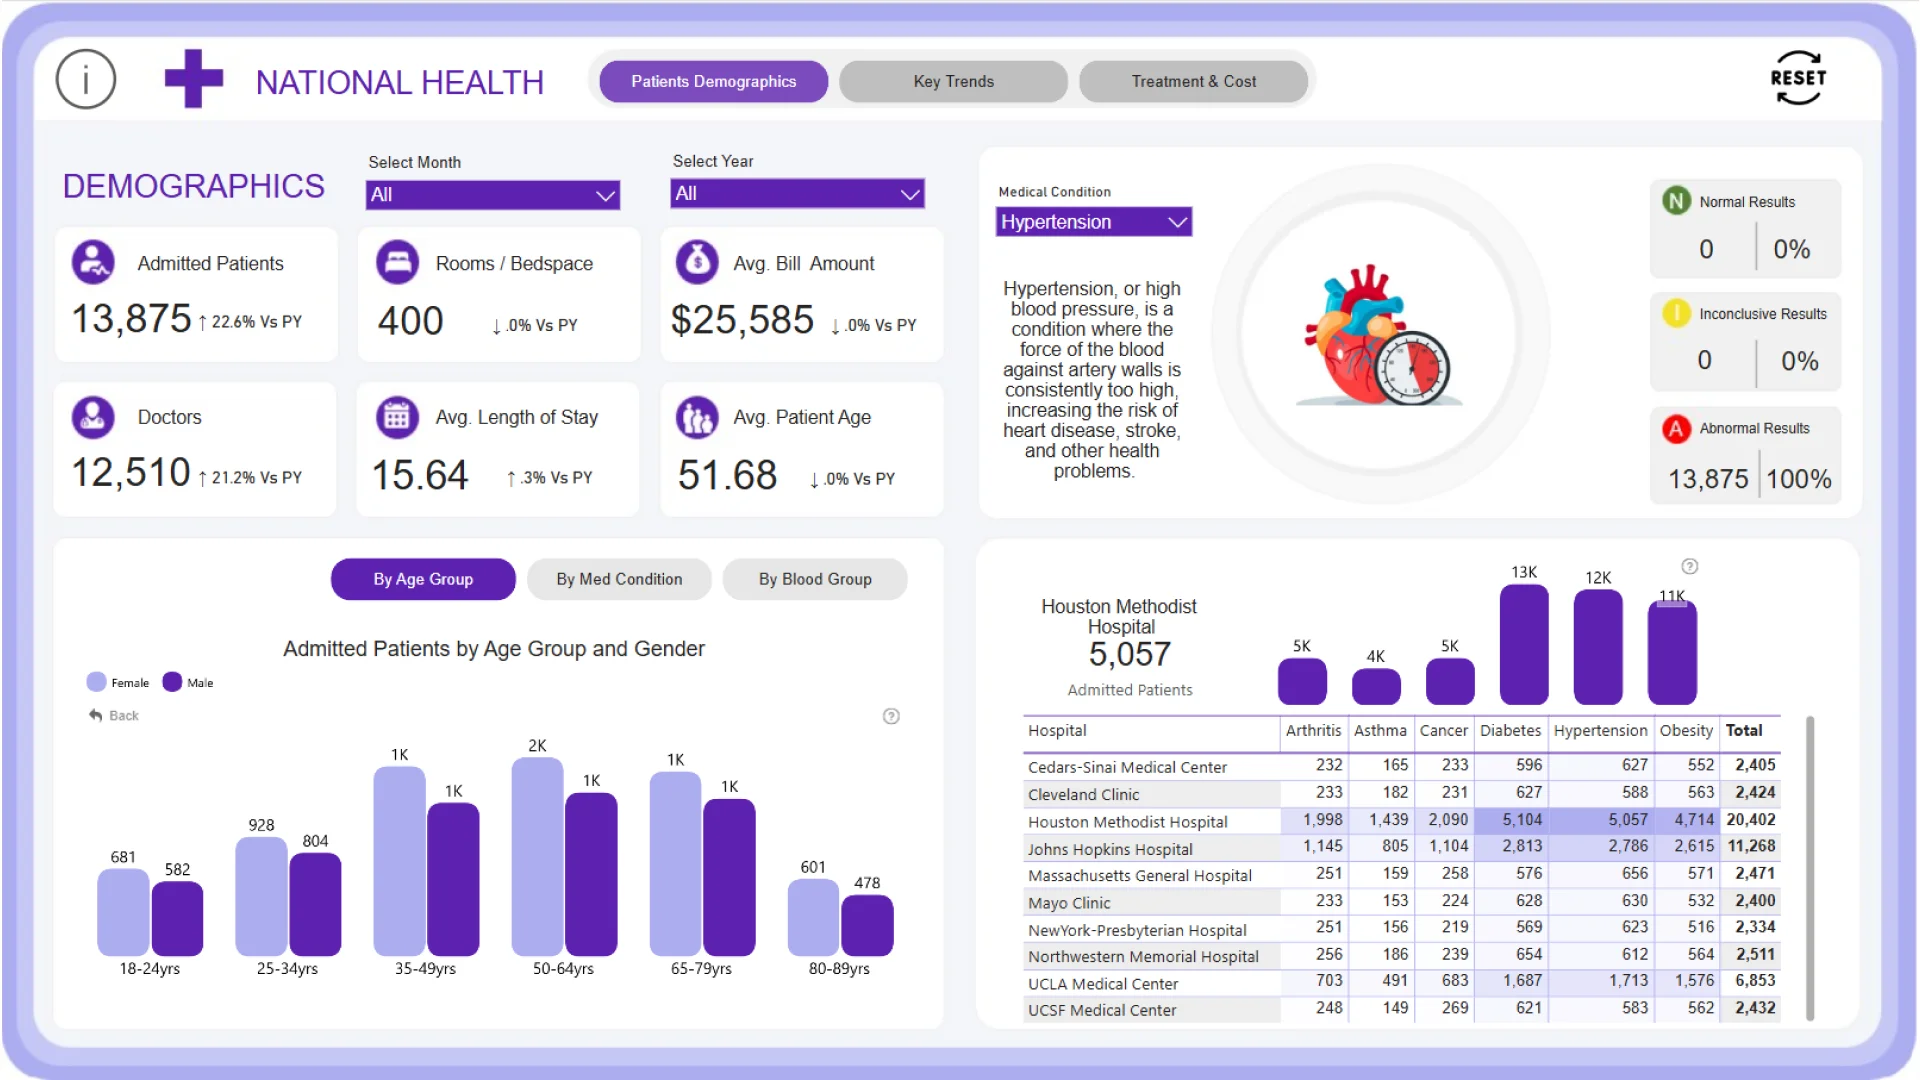
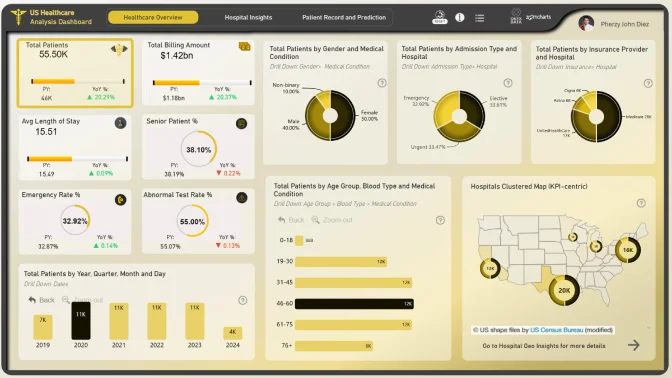
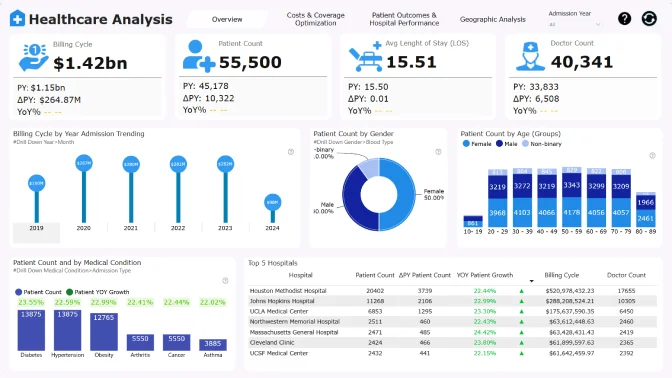
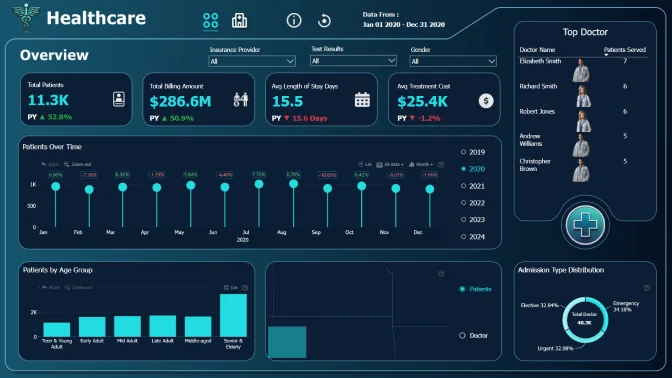
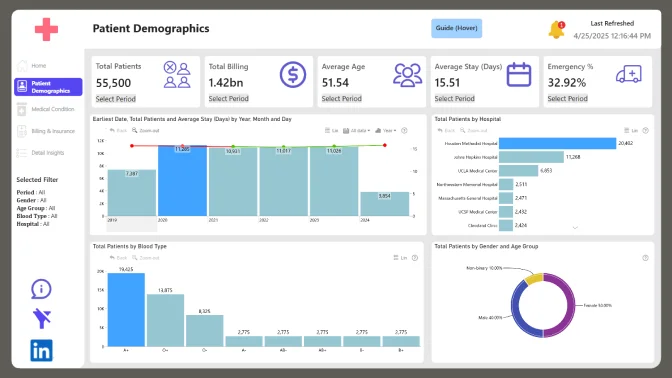
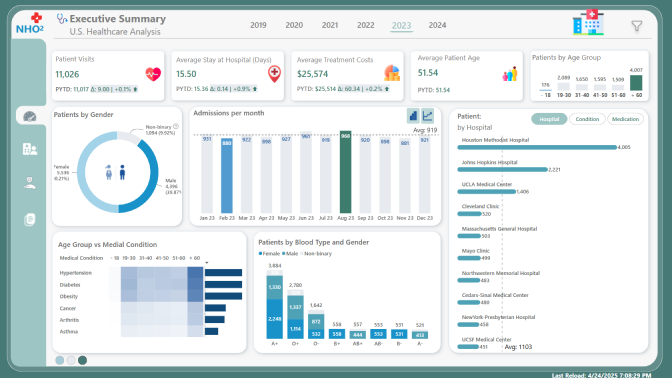
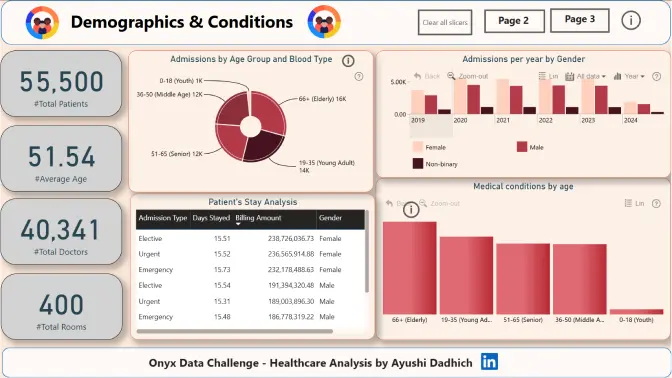
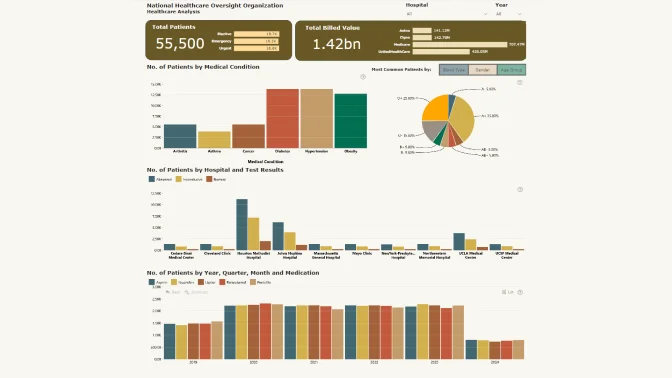
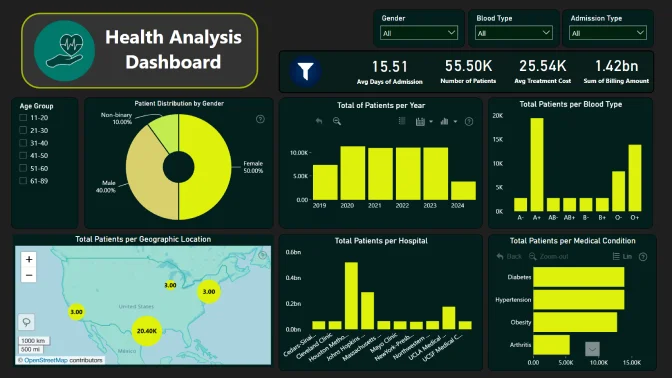
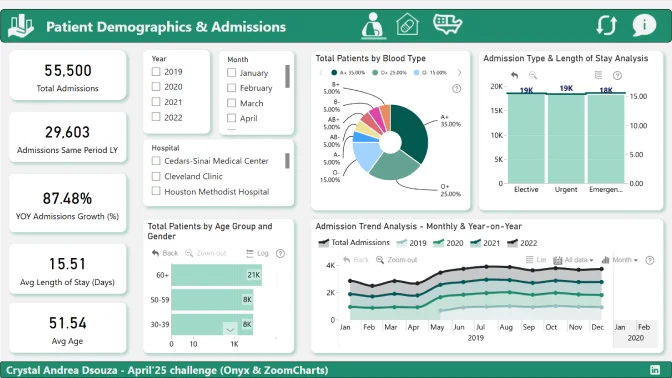
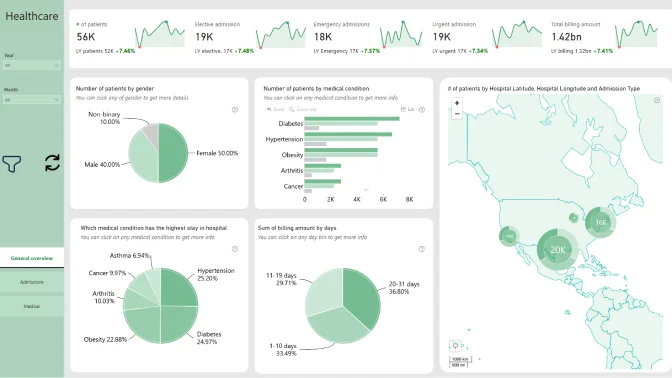
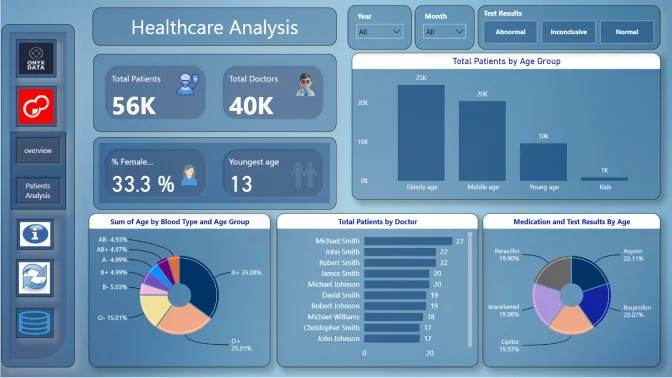
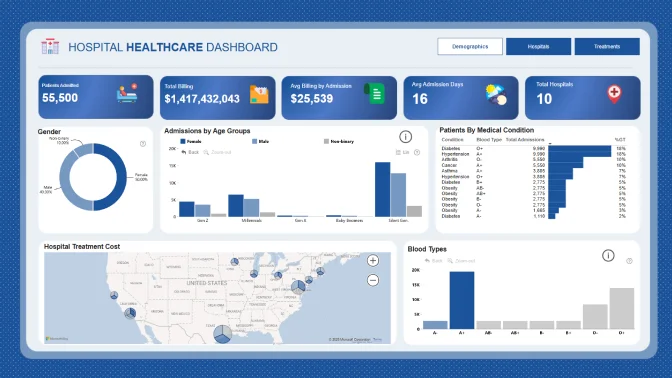
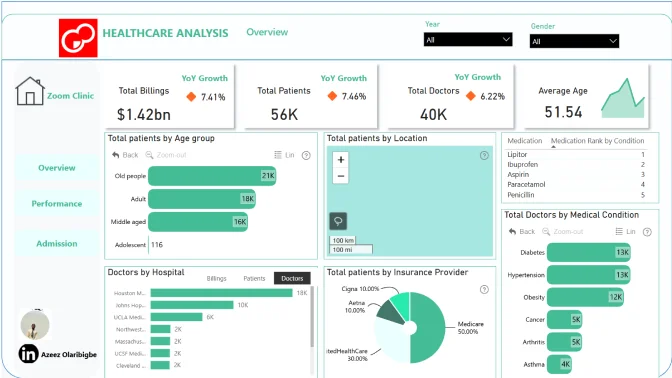
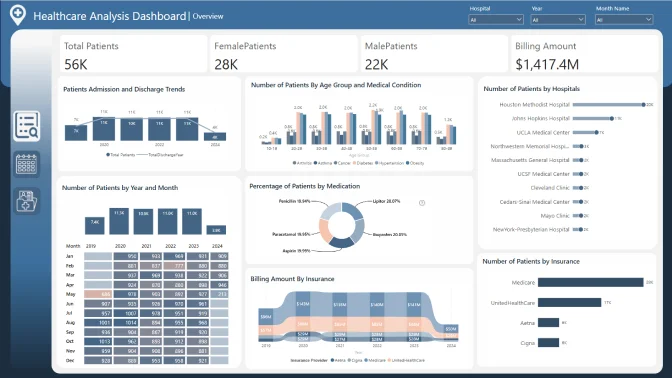
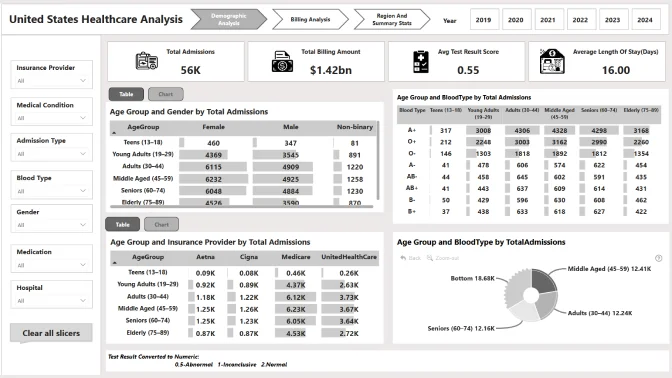
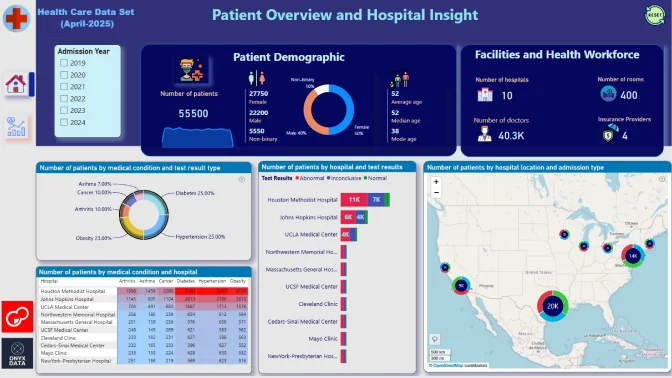
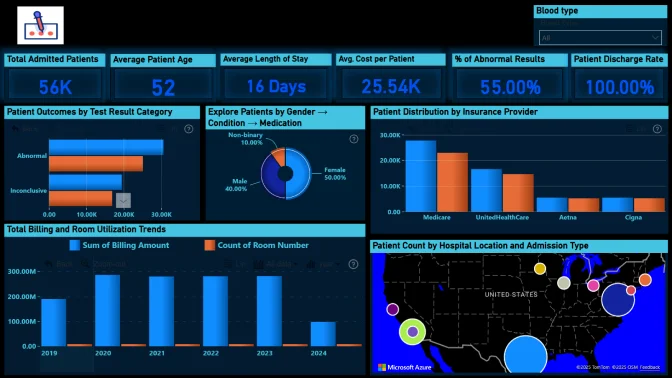
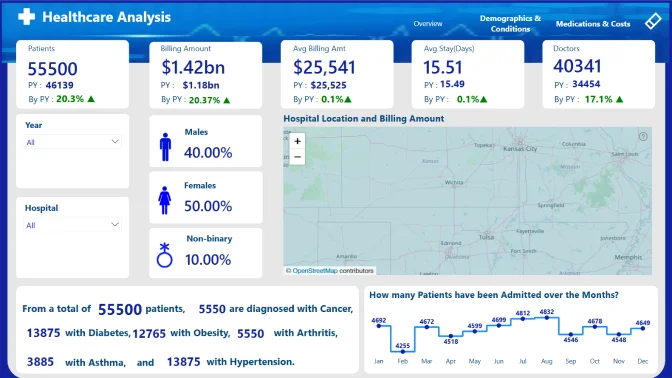
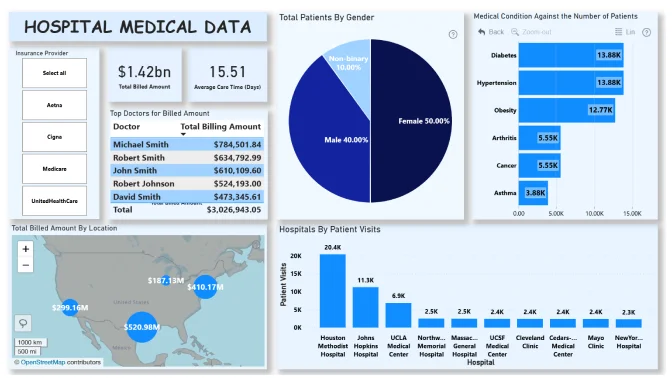
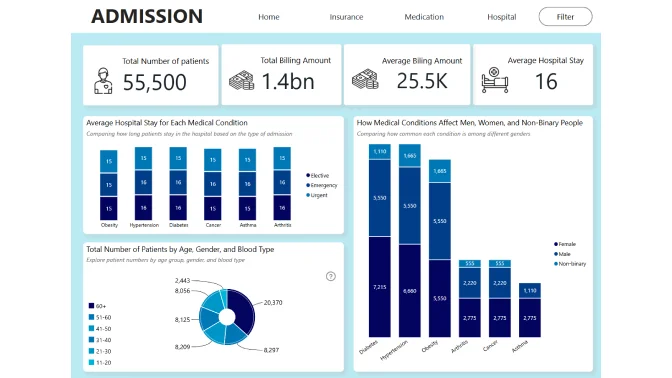
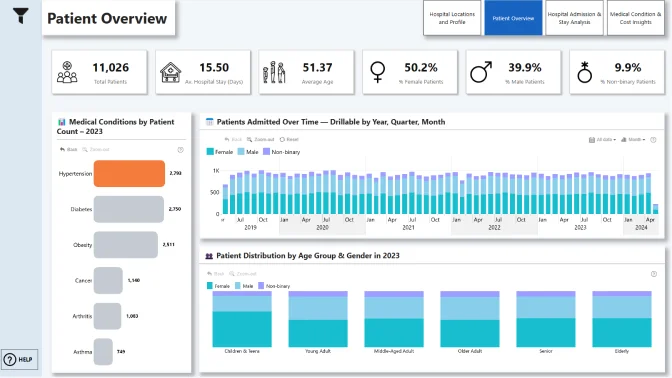
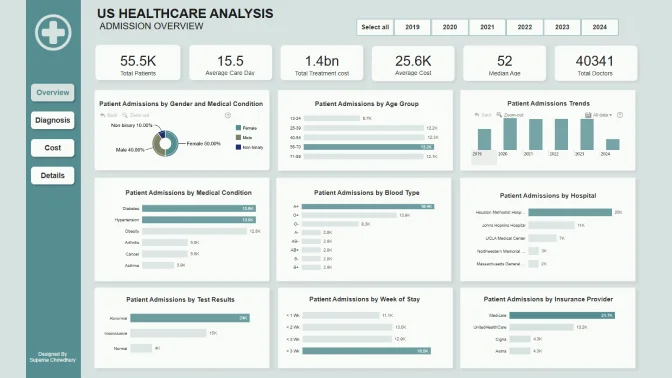
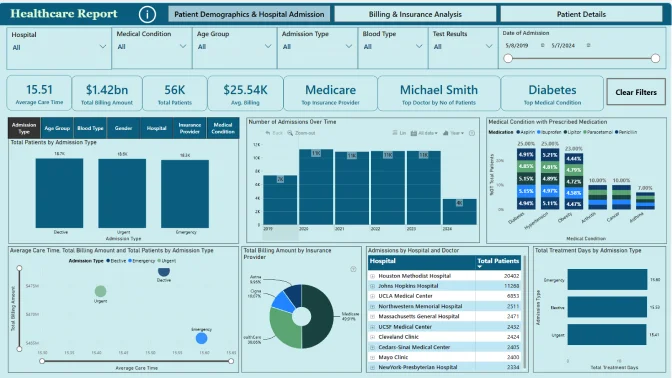
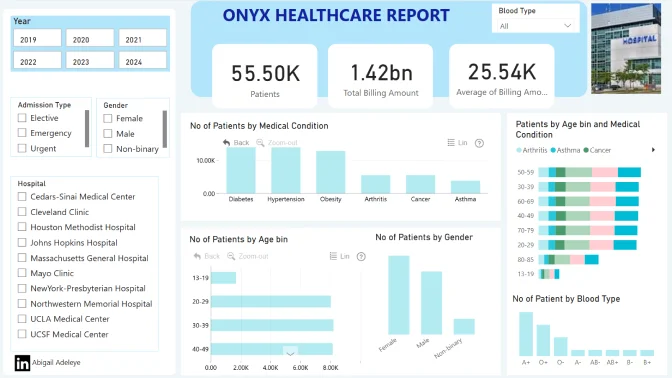
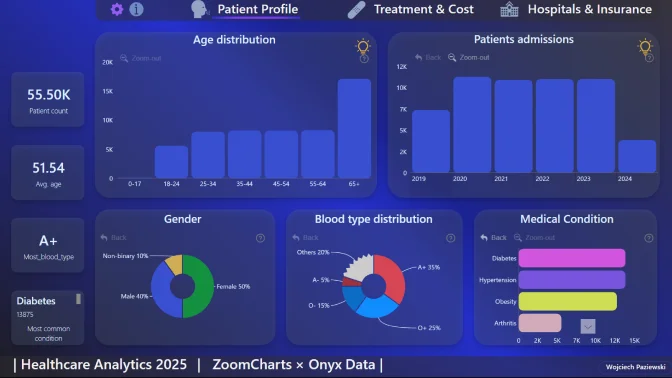
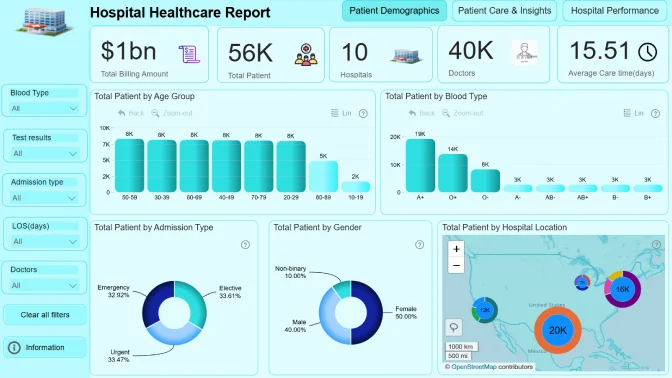
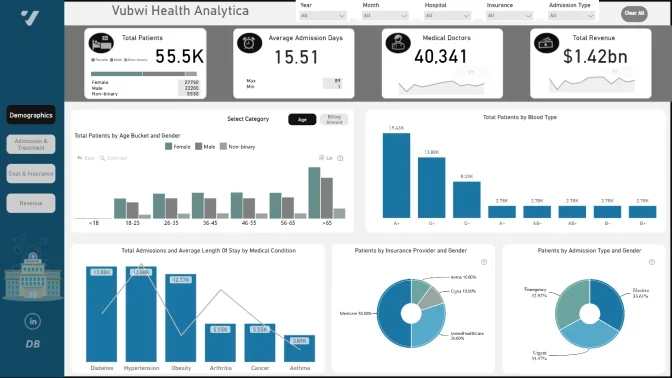
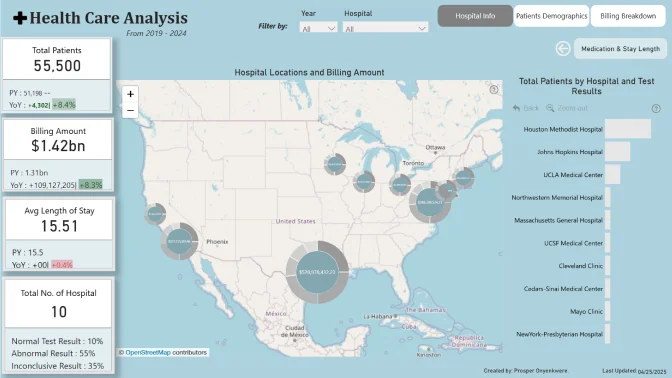
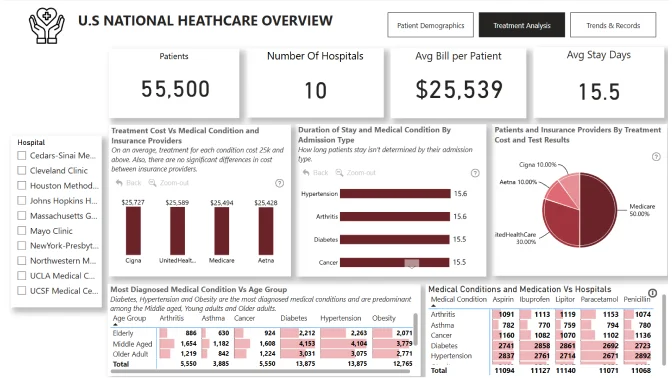
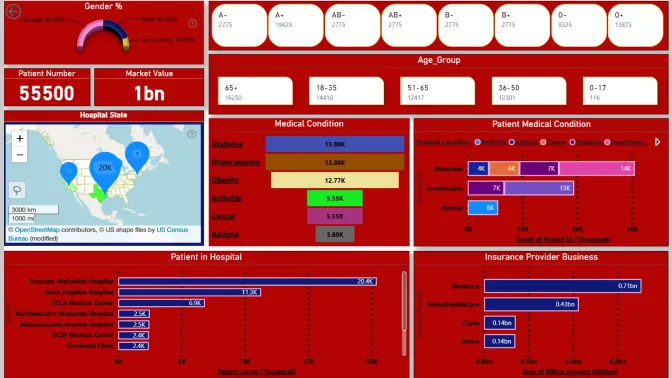
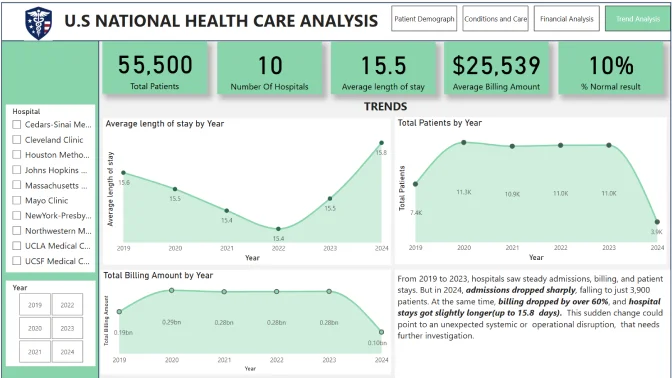
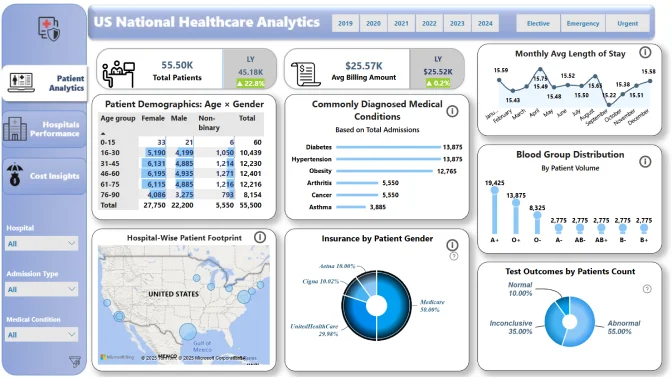
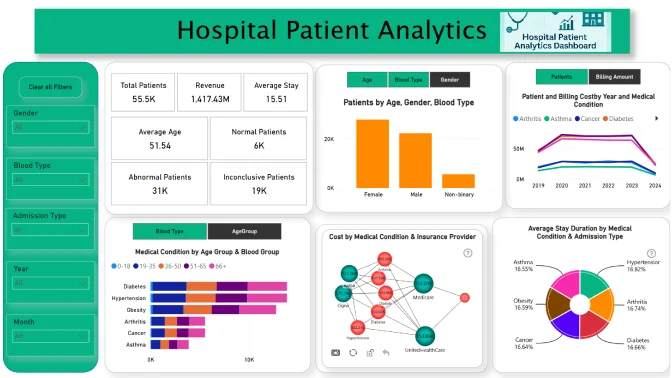
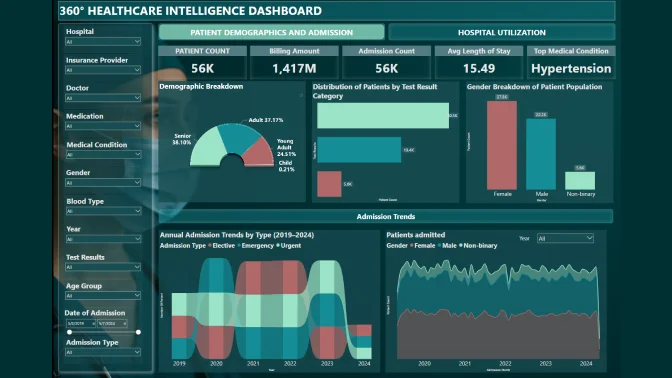
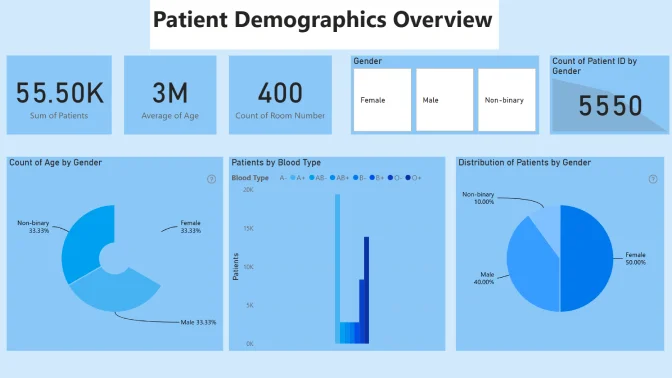
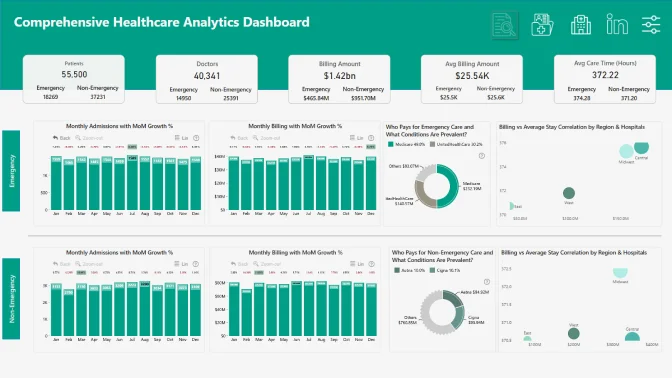
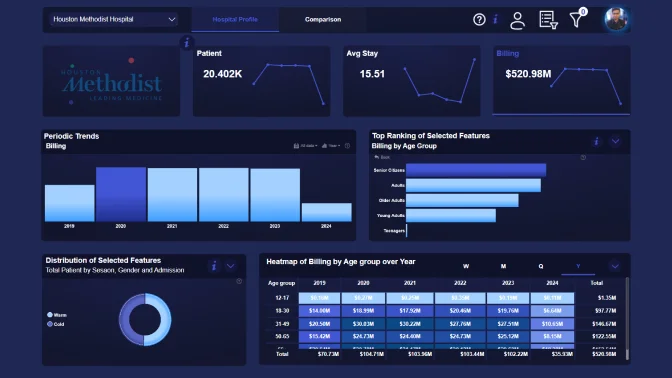
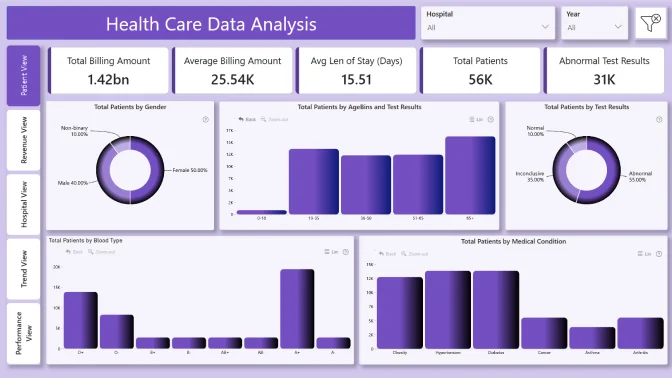
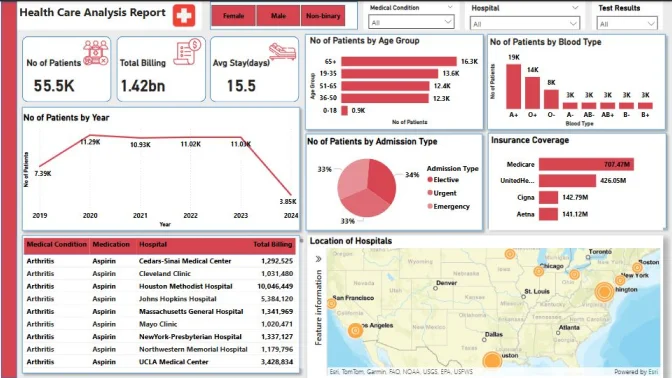
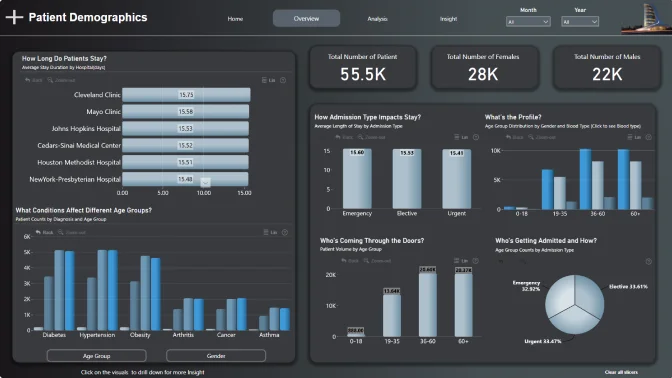
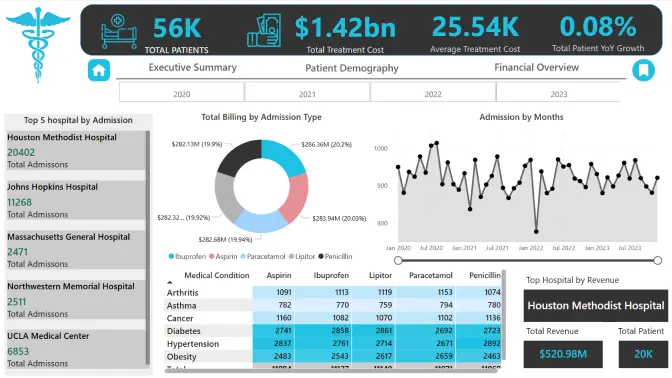
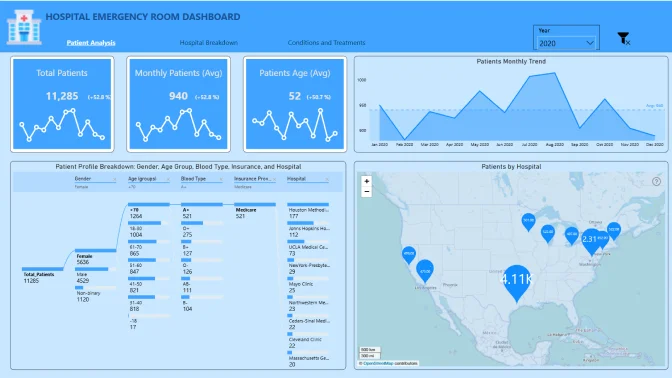
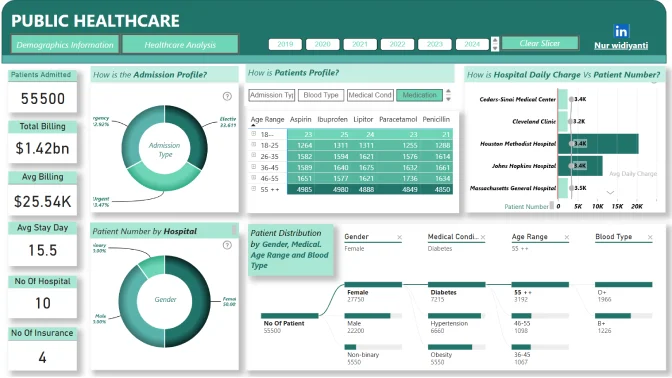
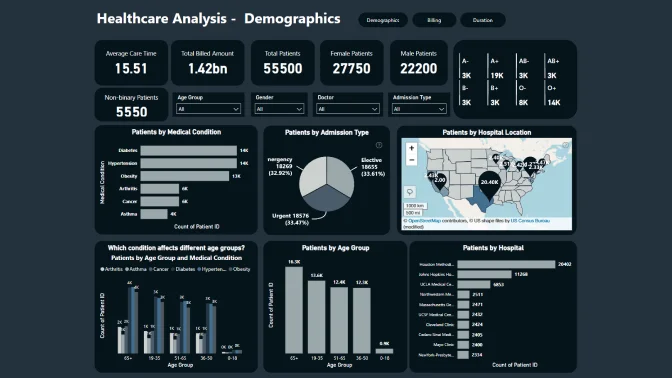
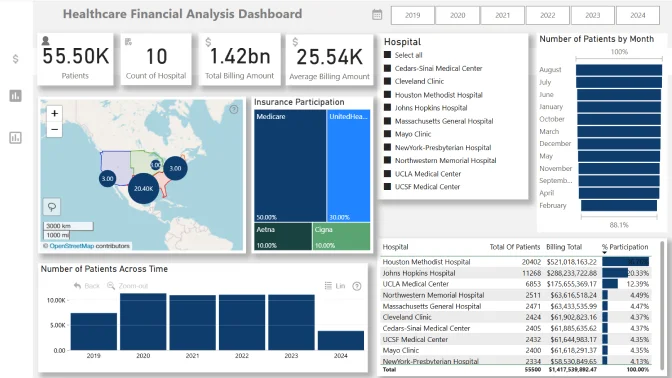
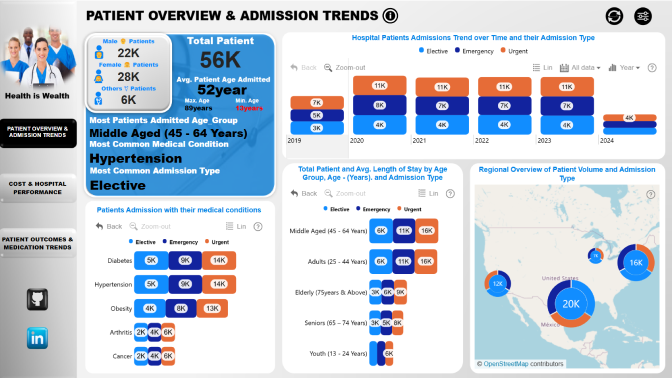
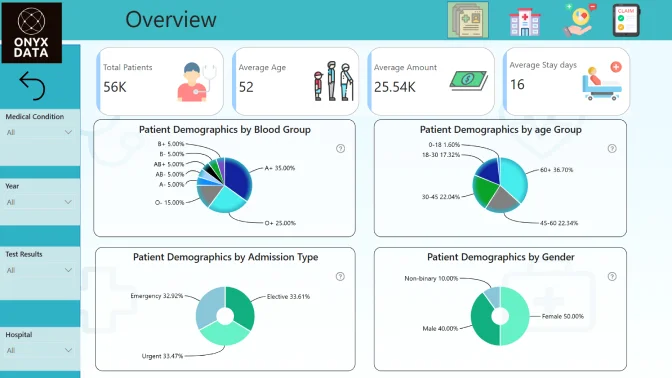
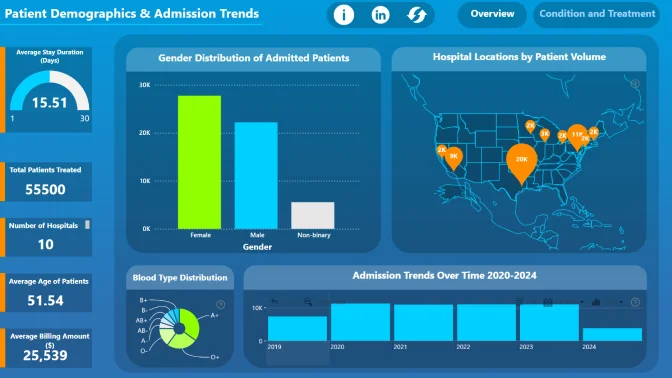
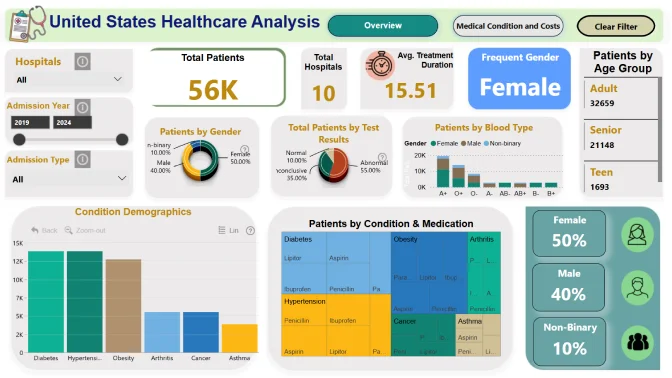
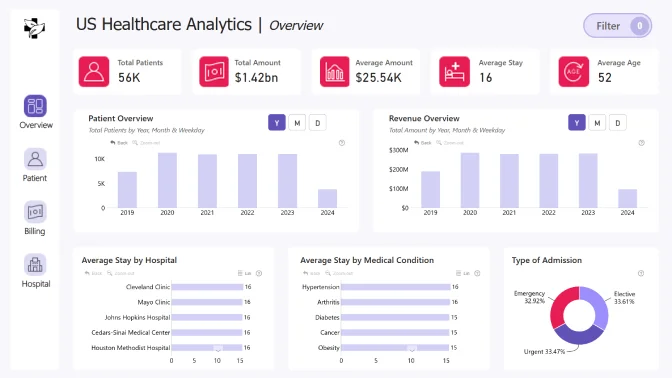
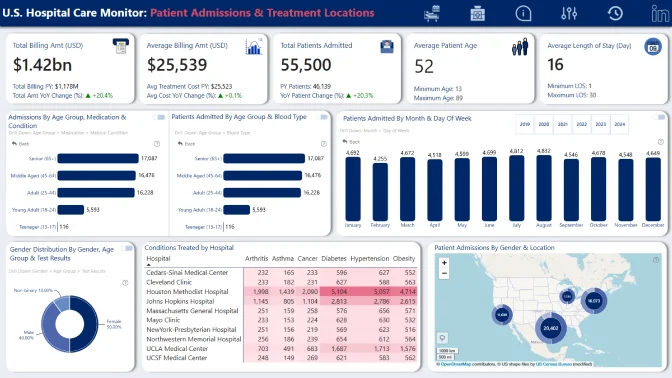
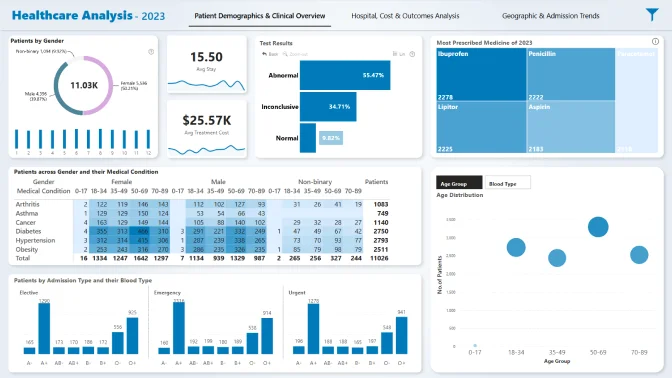
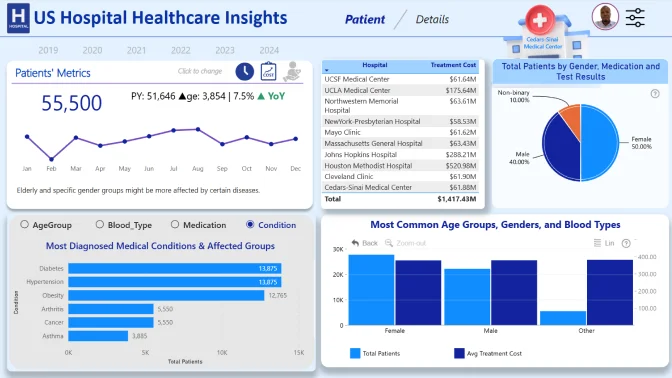
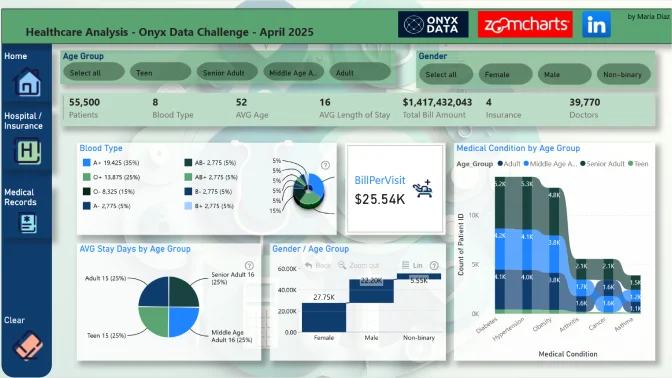
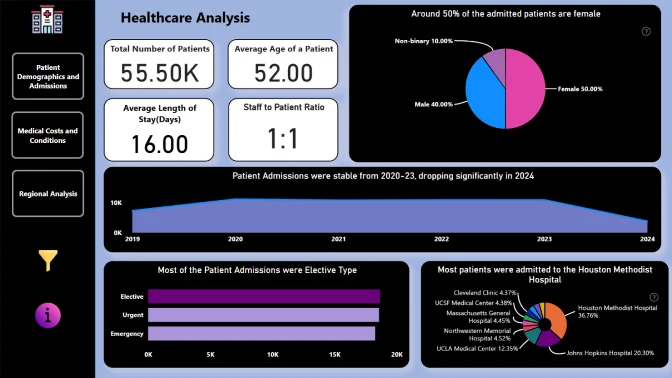
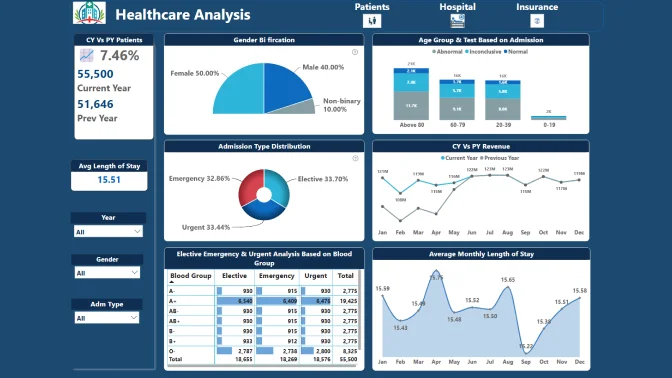
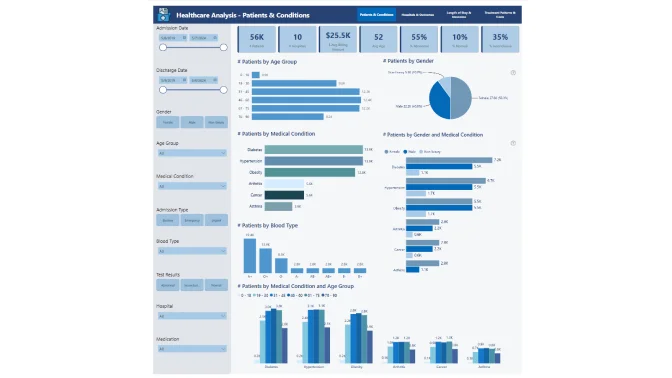
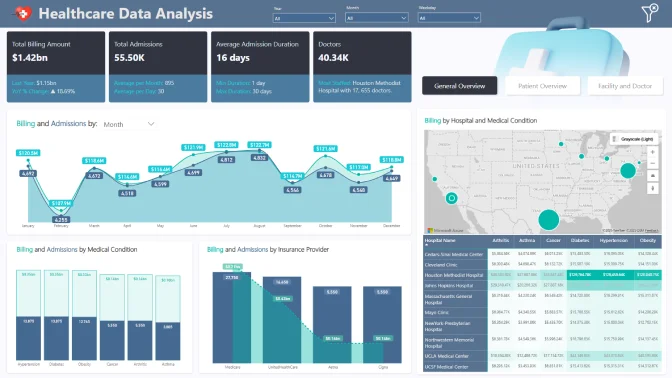
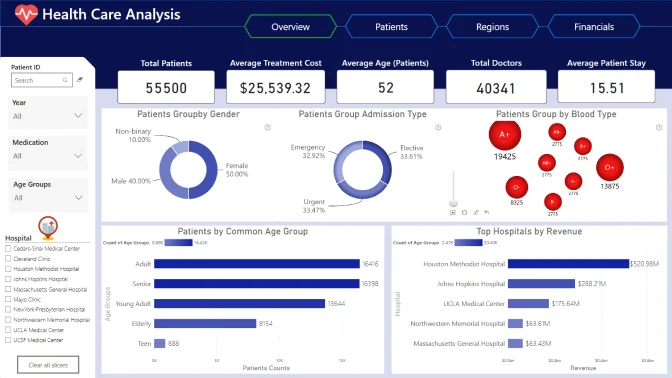
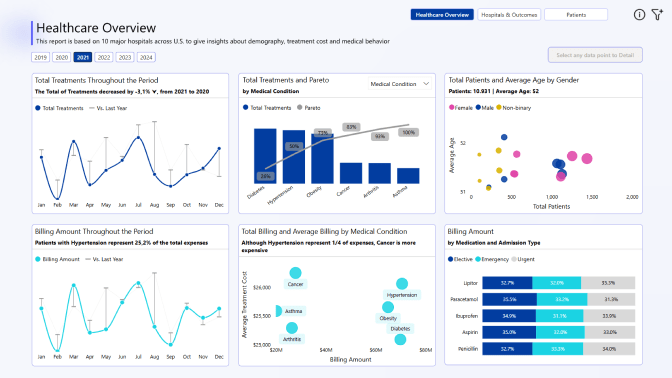
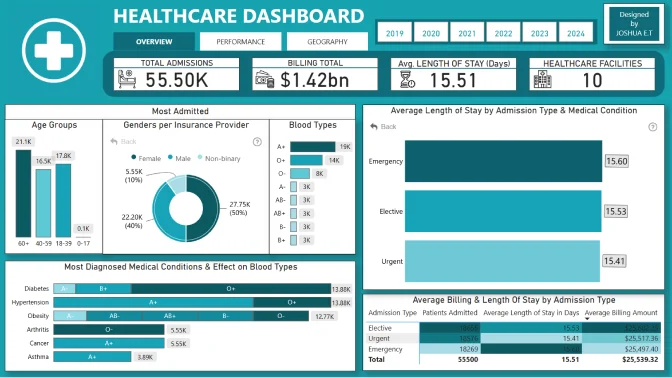
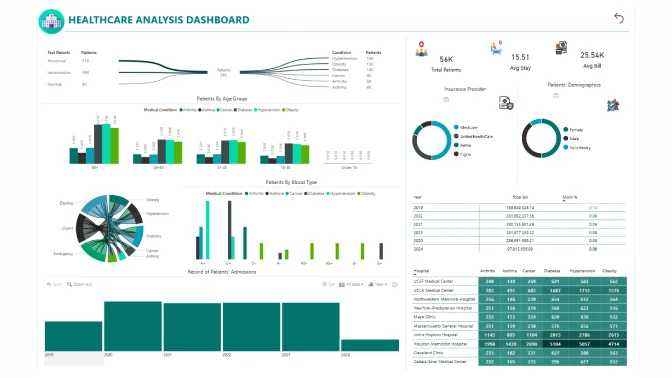
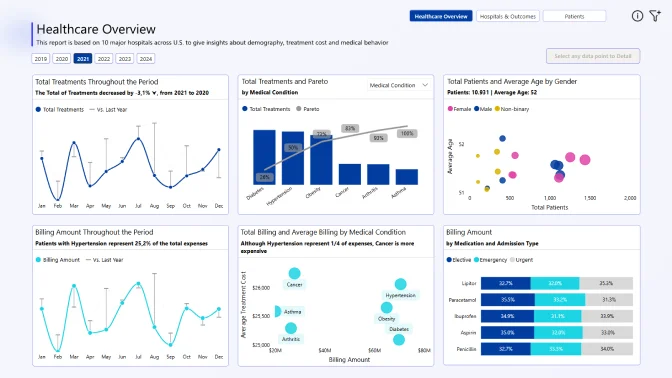
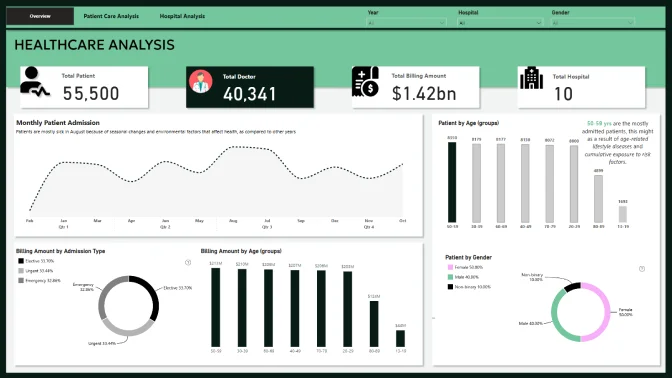
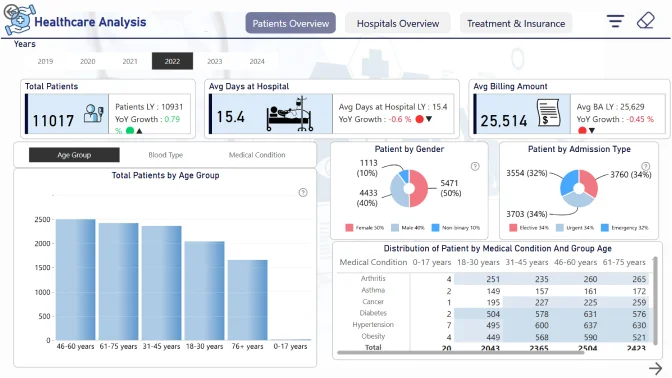
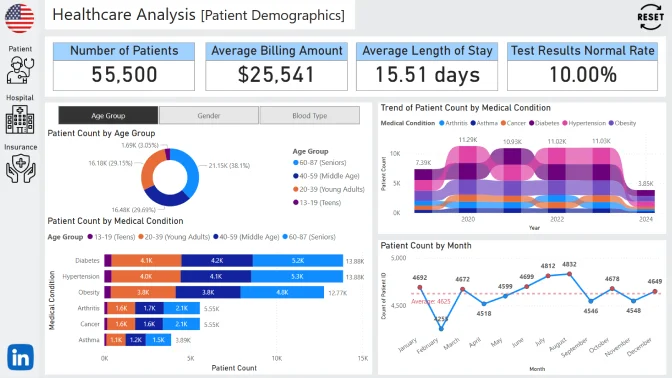
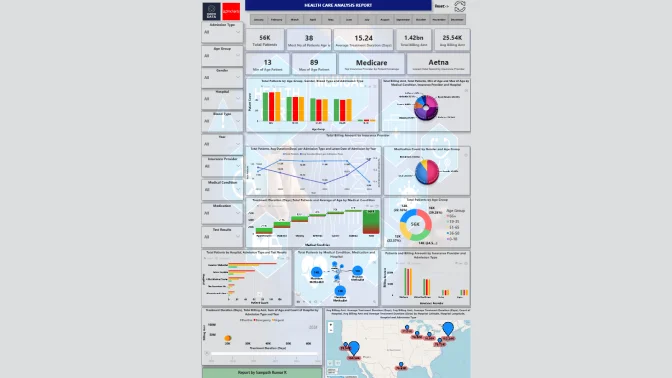
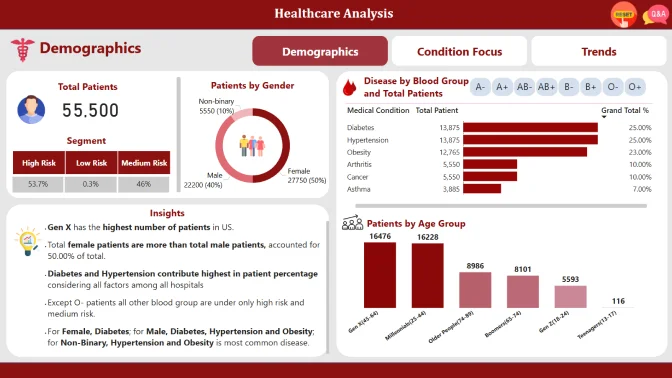
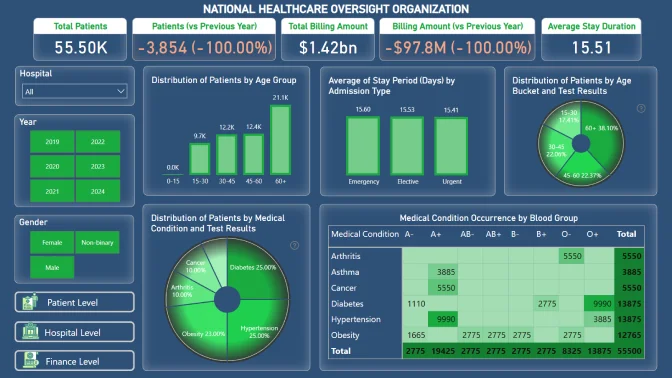
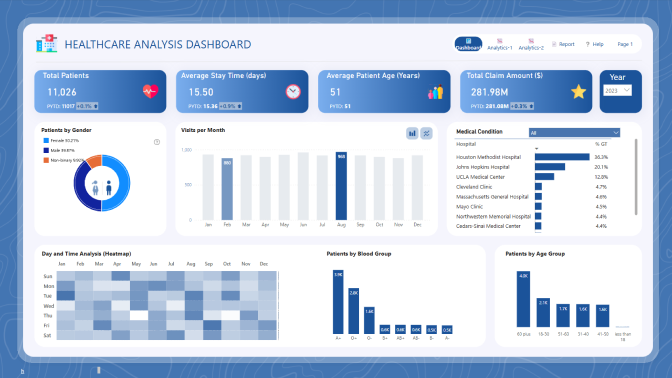
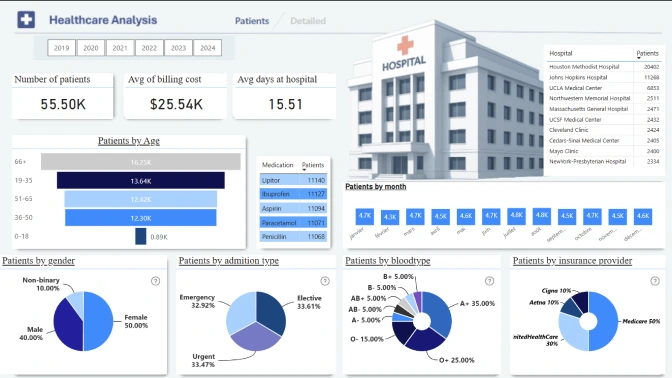
You are a data analyst at a national healthcare oversight organization. You’ve been given access to a dataset of 55,500 unique patient records from 10 major hospitals across the U.S. The dataset captures a broad view of hospital admissions, medical conditions, medications, insurance providers, and treatment costs. Your goal is to uncover insights that can drive better healthcare decisions, optimize costs, and improve patient outcomes. Create a compelling Power BI dashboard that tells the story of patient care across hospitals, identifies trends, and helps stakeholders make data-informed decisions.


Key Questions to Answer in Your Analysis:

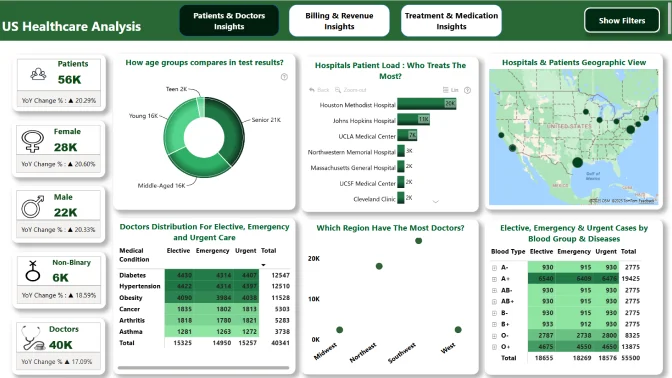
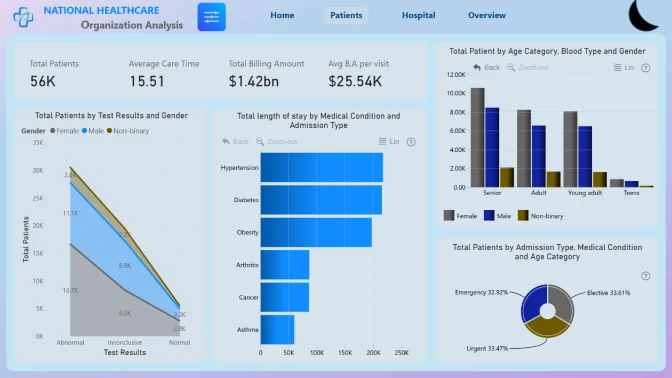
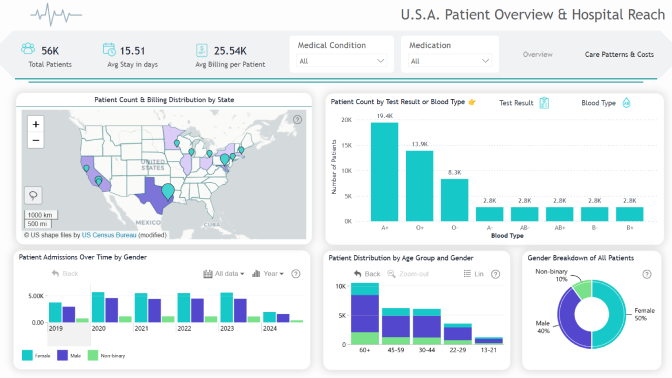
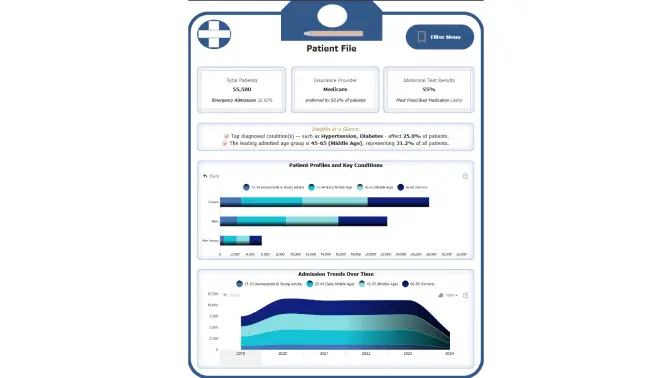
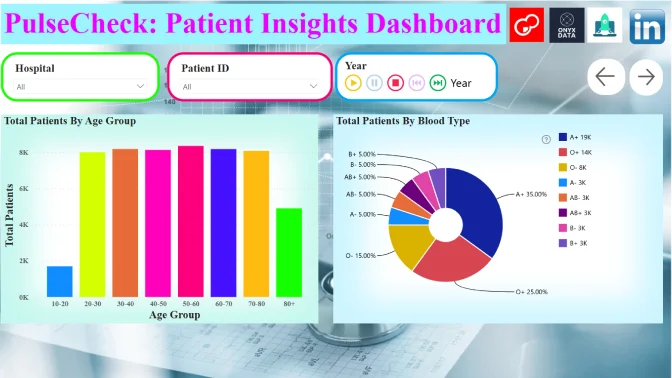
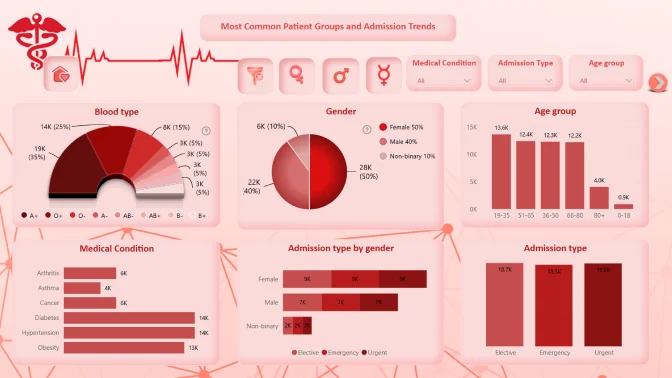
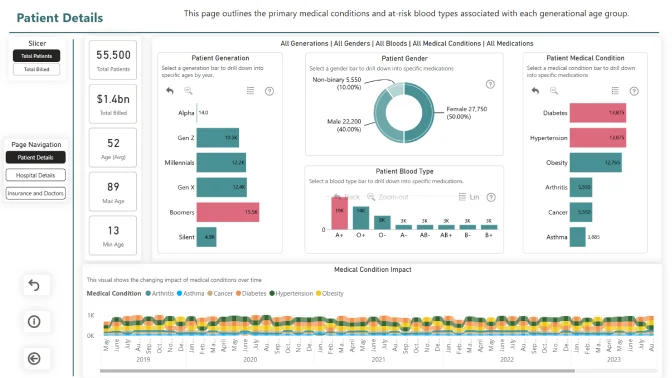
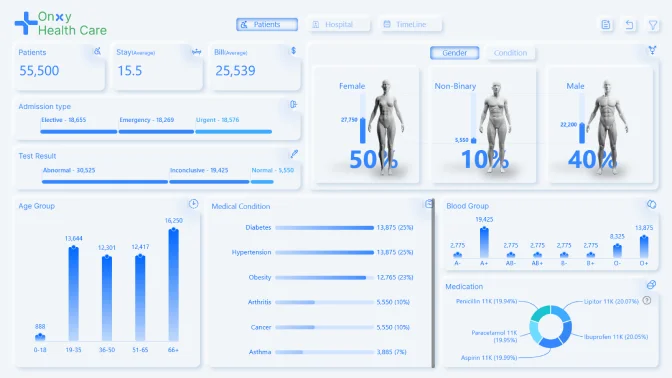
  1. What are the most common age groups, genders, and blood types among patients? Are certain groups being admitted more often than others?
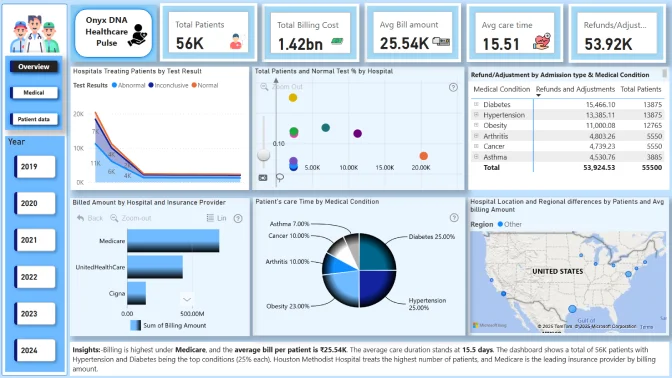
  2. Which medical conditions are diagnosed the most, and do they affect certain groups of people more than others?
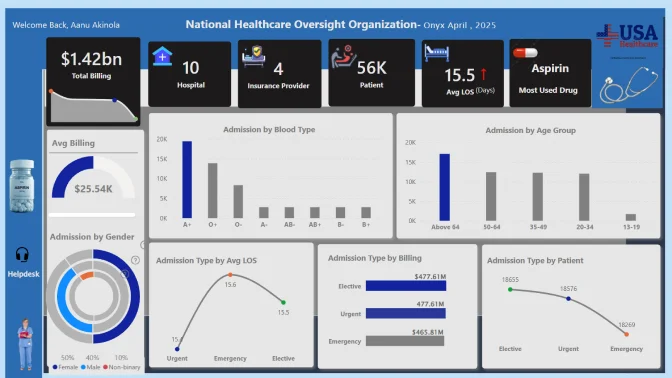
  3. How long do patients typically stay in the hospital for different conditions? Does this vary depending on the hospital or type of admission (emergency, urgent, or planned)?
  4. How much does treatment usually cost for each condition? Are there big differences in costs between hospitals or insurance providers?
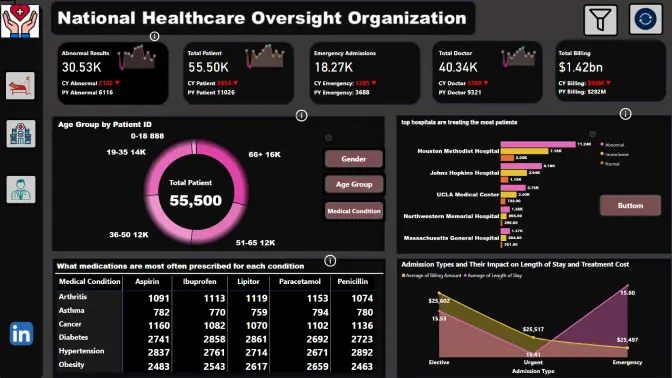
  5. Which hospitals are treating the most patients, and how do they compare in terms of patient outcomes, like test results?
  6. What medications are most often prescribed for each condition? Are they being used consistently across hospitals?
  7. How are patients admitted - mostly through emergency, urgent, or planned admissions - and how does that impact the length of stay or treatment costs?
  8. Which insurance companies are covering the most patients, and how does that relate to treatment costs and patient outcomes?
  9. Where are the hospitals located, and are there any regional differences in health conditions, treatment quality, or billing amounts?

Technical requirements

  • Build your report using only Power BI
  • The number of pages in the report is not limited
  • At least one report page has to contain a minimum of 2 ZoomCharts Drill Down Visuals. See a practical guide on Drill Down Visuals here

Judging criteria

Each report is evaluated based on three main criteria: intuitiveness, insightfulness, and interactivity. These factors ensure that the reports are not only accurate and functional, but also meet the target audience's needs and are ready to be presented to the end-users. 

  1. Intuitive: How clear and easy it is to understand the report at a glance? (max 15 points)
    • Is the report visually appealing?
    • Choice of charts and visual elements
    • Does the report tell a story?
    • Is it not overwhelming to the user?
    • Choice of tooltips, titles, and legends

  2. Interactive: How engaging and seamless is the report exploration and interaction with data? (max 15 points)
    • Clear navigation that allows user to explore the report
    • Use of slicers and other interactive elements
    • Smooth cross-chart integration
    • Is report optimized for touch devices?
    • Are tutorials and guiding elements helpful to the user?

  3. Insightful: How accurate, complete, and meaningful is the data in driving decisions? (max 15 points)
    • Depth of analysis
    • Data cleaning and preparation
    • Does data show up accurately in the report?
    • Is report optimized for quicker loading time?
    • Does the report provide deeper exploration of data (drill-down)?

Timeline

Registration Open

Registration Open

31 March | 19:00

-

Submissions Open

Submissions Open

31 March | 19:00

-

Workshop | Power BI for Healthcare – Unlocking Insights from Patient Data

Workshop | Power BI for Healthcare – Unlocking Insights from Patient Data

08 April | 08:00

-

1:1 Mentoring Sessions

1:1 Mentoring Sessions

08 April | 08:00

31 March - 24 April

Entry Submission Deadline

Entry Submission Deadline

24 April | 20:00

31 March - 24 April

Winner Announced

Winner Announced

30 April | 06:00

31 March - 24 April

Webinar | Top 5 Power BI Dashboards for Healthcare Analysis

Webinar | Top 5 Power BI Dashboards for Healthcare Analysis

30 April | 07:00

31 March - 24 April

Dataset

Get the dataset

See past Onyx Data April 2025 challenges

See past challenges

Your Drill Down Visuals Developers License

Use the email and password provided below to log in Power BI Desktop and access an account with a license to use all ZoomCharts Drill Down Visuals.

Upon logging in, you will need to change your password and enable two-factor authentication. If you encounter any problems, feel free to reach out to us via chat.

*This Developer License can be used to create a report for this ZoomCharts Mini Challenge or for your personal training purposes. Commercial use of this license is prohibited.

Upload failed
Attach file
File requirements: 16MB

Any questions? Feel free to use chat!

Are you sure you want to delete the report?

Activate your Drill Down visuals Developer License!

You can use these credential to access ZoomCharts visuals and create your report for this ZoomCharts Mini Challenge, or for your personal training purposes.


logo
[email protected]
+44 204 577 3993
logo

Products

Drill Down Network PRO Drill Down Waterfall PRO Drill Down Graph PRO Drill Down Combo PRO Drill Down Combo Bar PRO Drill Down Donut PRO Drill Down Pie PRO Drill Down TimeSeries PRO Drill Down Timeline PRO Drill Down Map PRO Drill Down Scatter PRO All Visuals

Resources

Report Examples Webinars Blog ZoomCharts Academy Visuals Gallery Documentation Custom Visual Development Subscribe to News

Solutions

Custom Visual Development

Company

Pricing About Us Partners Leave feedback Join PowerGroup EU Funding

Help

ZoomCharts Assistance Contact Sales Contact Support FAQ

Drill Down Network PRO Drill Down Waterfall PRO Drill Down Graph PRO Drill Down Combo PRO Drill Down Combo Bar PRO Drill Down Donut PRO Drill Down Pie PRO Drill Down TimeSeries PRO Drill Down Timeline PRO Drill Down Map PRO Drill Down Scatter PRO All Visuals

Report Examples Webinars Blog ZoomCharts Academy Visuals Gallery Documentation Custom Visual Development Subscribe to News

Custom Visual Development

Pricing About Us Partners Leave feedback Join PowerGroup EU Funding

ZoomCharts Assistance Contact Sales Contact Support FAQ
+44 204 577 3993
[email protected]

Ready to get in touch?

Contact our experts with any question about Power BI and ZoomCharts for Free!

Contact us

© 2025, Data Visualization Software Lab

U.S. Patents No. 11,645,343; 11,921,804

Cookies Policy
Manage cookies
Privacy Policy
Global
EULA
Patent
warning

Error message

success

Success info: Done!

ZoomCharts AI Assistant

We noticed you're using an old OS version.

For the best experience, we recommend upgrading to ensure that all website features display correctly.

Cookie settings

We use necessary cookies for site functionality, as well as statistic, marketing, and preference cookies to enhance your experience. For more information and to manage your preferences, please visit our Cookie policy