Dec 19, 2025
Building Santa's Network: A Guide to Creating JavaScript Charts with AI
How we built an engaging Christmas-themed network visualization using Lovable and ZoomCharts - with practical prompting strategies you can use today.
How we built an engaging Christmas-themed network visualization using Lovable and ZoomCharts - with practical prompting strategies you can use today.
Introduction
Every holiday season, we're reminded of the magical complexity behind Christmas. But have you ever stopped to consider just how intricate Santa's operation really is? From managing a global team of elves to coordinating with international holiday figures, the North Pole runs what might be the world's most sophisticated network.
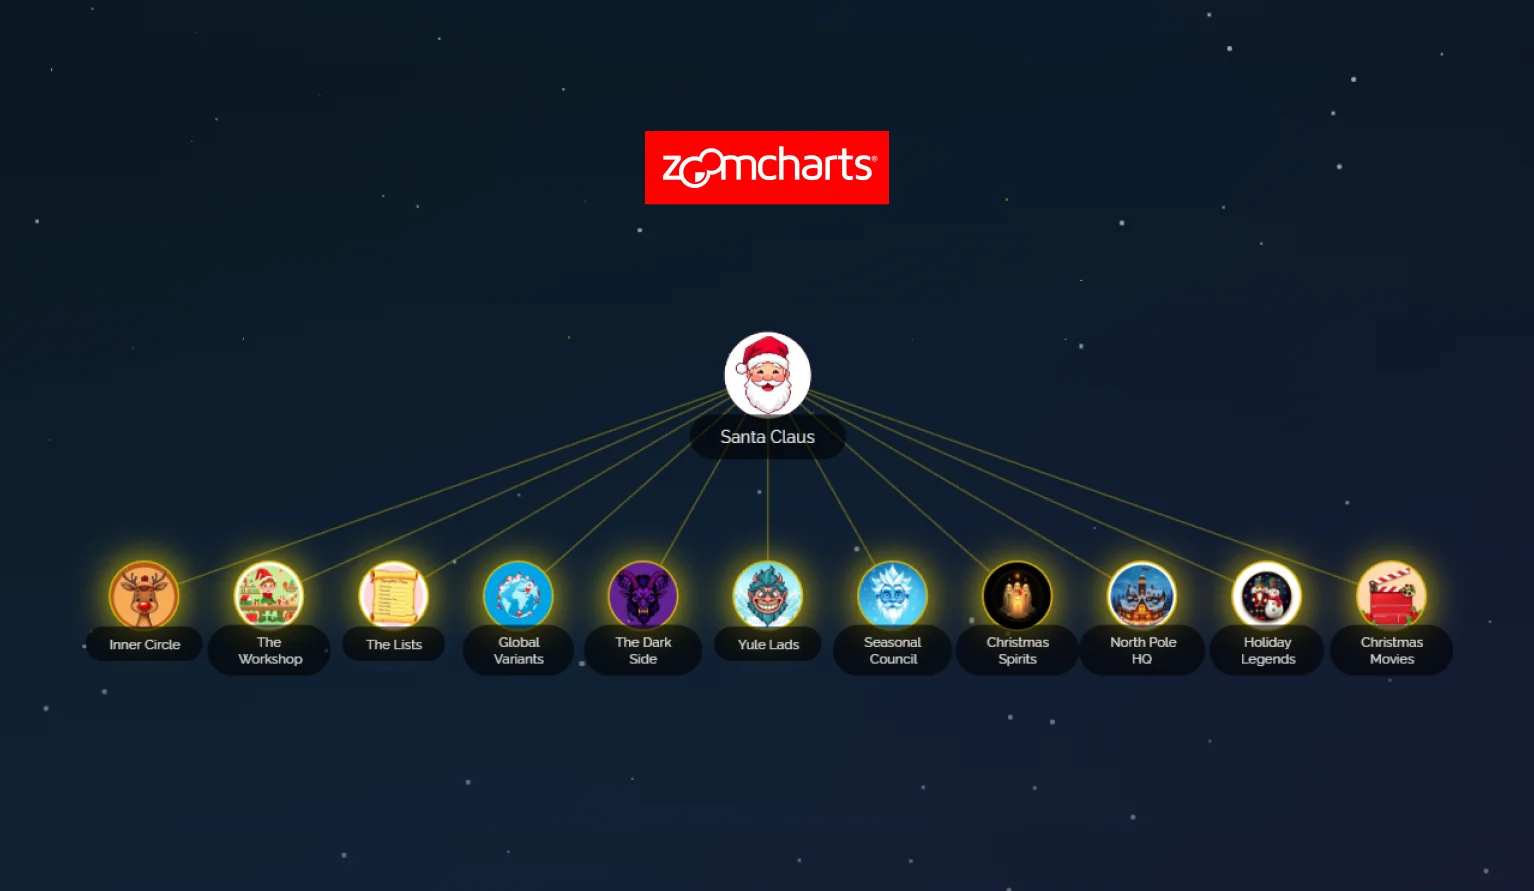
This sparked an idea: what if we could visualize this complexity in an interactive, explorable way? The result is Santa's Network - a fully functional web application that lets users discover the hidden connections between Christmas characters, departments, and cultural traditions from around the world.
But this isn't just a showcase of festive creativity. It's a demonstration of how modern AI-powered development tools have fundamentally changed what's possible for solo developers, small teams, and anyone with an idea they want to bring to life.
In this comprehensive guide, you'll find the exact prompting structure used to build the experience, plus a repeatable framework for creating your own interactive visualizations.
You can explore the finished experience here: https://demo.zoomcharts.com/santas-network/
The Vision
Before diving into the technical implementation, Santa's Network was designed with four goals in mind:
- Educational Entertainment
The visualization teaches users about Christmas traditions from different cultures - from the Icelandic Yule Lads to the Italian Befana - while keeping them engaged through exploration and discovery. - Gamification
Rather than presenting all information at once, users click through the network to "discover" nodes. A progress tracker shows completion percentage, and a celebration animation rewards users who explore everything. - Technical Demonstration
The project showcases what's achievable with modern web technologies: smooth animations, responsive design, complex data relationships, and professional-grade interactivity. - Accessibility
Despite its complexity, the interface is designed to be intuitive for users regardless of technical background.
Technology Stack
ZoomCharts: The Visualization Engine
At the heart of Santa's Network is ZoomCharts, a powerful JavaScript library for creating interactive data visualizations. Unlike simpler charting libraries, ZoomCharts excels at:
- Network and graph visualizations with hundreds of interconnected nodes
- Smooth zooming and panning that feels native and responsive
- Dynamic data loading for performance optimization
- Rich customization options for styling and behavior
The library handles force-directed layouts, collision detection, and smooth animations - allowing the application to focus on experience design and interaction flow.
Lovable: The Development Platform
Lovable served as the AI-powered development environment that transformed ideas into working code. Built on React, Vite, TypeScript, and Tailwind CSS, Lovable provides:
- Conversational development through natural language prompts
- Real-time preview with instant feedback
- Integrated tooling without setup overhead
- Iterative refinement through continued conversation
Supporting Technologies
- React 18 for component architecture
- TypeScript for type safety and developer experience
- Tailwind CSS for rapid, consistent styling
- Framer Motion concepts for smooth animations
- shadcn/ui for polished UI components
Step-by-Step Prompting Guide
Use this sequence to build a discovery-driven network visualization from scratch. Each step is designed to be a single, focused prompt that Lovable can implement reliably before moving on.
Phase 1: Foundation and Core Concept
Goal: Define the scope, interaction model, and data structure before UI polish.
Step 1: Start with the Big Picture
What to request: Core experience, key entities, interaction expectations, and visual direction.
Example Prompt:
I want to create an interactive network visualization that shows Santa's organizational structure. It should include Santa at the center, with connections to Mrs. Claus, the reindeer team, elf departments, and international Christmas figures like Father Frost and Sinterklaas. Users should be able to click on nodes to explore connections and learn about each character. Make it visually festive with a Christmas theme - dark background with red and green accents, snowfall effect, and warm holiday feeling.
Why it matters: This provides enough context for the AI to generate a correct starting architecture.
Step 2: Define the Data Structure
What to request: A clear node schema and a small starter dataset.
Example Prompt:
Create a data structure for the network. Each node should have: an id, a name, a description (2–3 sentences), a category (like 'inner-circle', 'reindeer', 'international', 'elf-staff'), connections to other node IDs, and an image path. Start with about 20 core nodes covering Santa's immediate family and team.
Tip: Keep the initial dataset small. Expand after the interaction model works.
Phase 2: Core Functionality
Goal: Make the graph interactive and ensure discovery + detail UX works end-to-end.
Step 3: Implement the Visualization
What to request: ZoomCharts integration, node rendering, basic interaction, and initial view state.
Example Prompt:
Integrate ZoomCharts to display the network data. Nodes should show character images in circles, with their names below. Connection lines should be subtle but visible. When a user clicks a node, mark it as discovered and show a detail panel on the side. Initially, only Santa should be visible.
Step 4: Add the Discovery Mechanic
What to request: Progressive reveal logic, discovered-state tracking, persistence.
Example Prompt:
Add a discovery system where nodes start hidden. Clicking a discovered node reveals connected nodes, but they must be clicked to be fully discovered. Track discovered nodes and persist progress in localStorage.
Step 5: Create the Detail Panel
What to request: A consistent information surface for selected nodes.
Example Prompt:
When a node is clicked, show a slide-in panel from the right. Display the character image, name, category badge, description, and a list of connections. Include a close button and allow clicking outside to dismiss.
Phase 3: Polish and Enhancement
Goal: Add progress feedback and improve the overall feel of the experience.
Step 6: Add Progress Tracking
What to request: Completion feedback, progress UI, and end-state celebration.
Example Prompt:
Add a progress tracker showing X of Y nodes discovered, with a percentage and progress bar. When complete, show a celebration animation or message.
Step 7: Improve Visual Design
What to request: Theme styling, background effects, responsive layout polishing.
Example Prompt:
Make the design more festive. Add subtle snowfall in the background, use deep navy or forest green backgrounds with gold and red accents, and include a holiday-style header. Ensure responsiveness on mobile.
Step 8: Add Helper Features
What to request: Guidance UI for users who get stuck during exploration.
Example Prompt:
Add an unexplored nodes sidebar that hints where undiscovered nodes might be found, helping users who get stuck.
Phase 4: Content Expansion
Goal: Scale the dataset and improve visual consistency with custom assets.
Step 9: Expand the Dataset
What to request: More nodes, more categories, and meaningful connections.
Example Prompt:
Expand the network to 50+ nodes, including Christmas movies, movie characters, Christmas spirits, and more international figures. Each should have unique descriptions and meaningful connections.
Step 10: Add Custom Images
What to request: Consistent avatar style and asset organization.
Example Prompt:
Generate festive, cartoon-style avatar images for each character. Keep the style consistent and save them in a dedicated assets folder.
Advanced Prompting Strategies
Strategy 1: Iterative Refinement
Use short follow-ups to adjust what already exists.
- The node labels are hard to read. Make them white with a subtle shadow.
- The detail panel feels cramped. Increase padding and image size.
Strategy 2: Reference What Exists
- Reduce snowfall density by half and slow the animation speed.
Strategy 3: Ask for Options
- Show three different celebration ideas for completing the network.
Strategy 4: Break Down Complex Requests
- First, just log the clicked node name to the console.
Lessons Learned
- Start simple, expand gradually - Begin with a small node set and scale up.
- Visual polish matters - Premium feel can outweigh minor functional quirks.
- Test on real devices - Touch interactions behave differently than mouse input.
- Content is king - Writing and structuring node content can take longer than coding.
- AI collaboration is a skill - Clear prompts produce better outputs and fewer iterations.
Example in Action
If you want to see the final result in action, explore the live demo: https://demo.zoomcharts.com/santas-network/
This demo shows how the discovery mechanics, progress tracking, animations, and ZoomCharts network visualization come together into a cohesive, playful experience.
Conclusion
Santa's Network demonstrates what's possible when creative vision meets AI-powered development tools. What once took weeks can now be accomplished in days through iterative conversation.
The prompting framework outlined here applies to any interactive visualization - from corporate org charts to product maps or educational experiences.
Start with a clear vision, communicate it well, and iterate until it shines.
Now go build something magical. 🎄

Want more info like this?
Subscribe to our newsletter and be the first to read our latest articles and expert data visualization tips!