NetChart
Ultimate JavaScript Network chart package for Graph Visualization and Exploration. With NetChart package you can create Network, Hierarchy, Bubble, Dot Matrix and even Radial graph chart types.
It's easy to set-up and customize
Complex network and graph structures become easily understandable and explorable with Net Chart charts package. Customize nearly every aspect of look and feel of these highly performing javascript charts

Nodes
Every object in the network has it's node with various dynamic and/or pre-set visual options.

Links
Links represent relations and different connection types between those objects.
Items
Place and position additional items on links and nodes. Use icons, custom fonts, icon fonts and various font styles.

Auras
Unique and graphically impressive way to divide graph data visualization into clusters.
Features
User Interactions
Move node
Moves the node to other position and switches the particular node to a "fixed" state so it stays where you placed it even if other parts of the network are being moved around.
Select
Selects a node making it available for further actions.
Multiple selection
Select multiple nodes making them available for further actions.
Clear selection
Clears the selection of all nodes.
Reveal tooltip
Shows info window (Modal window) with additional information about the node. Also has action menu by default.
Hide node
To make node and it's neighbours disappear from the visualization.
Collapse node
Collapses the nodes neighbours, leave the node visible.
Zoom in / zoom out
Control the zoom level of graph visualization.
Fit to screen
Fits all network to the screen by adjusting the zoom level and positioning of the network visualization. Layout of the nodes stays intact.
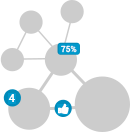
Give it a try!
This is an actual JavaScript chart demo. Hint shows you action to take. Follow the hints to interact with the chart.
Examples
Almost every aspect of NetChart appearance and functionality can be customized to fit your needs. Rich API enables endless integration options to satisfy most demanding requirements.
Get started with ZoomCharts
Start free to explore the possibilities of the Zoomcharts JavaScript charts library.
Get started