TimeChart
Ultimate JavaScript Network chart package for Graph Visualization and Exploration. With TimeChart package you can create Area, Bar, Line, Stream, Waterfall and Candlestick chart types.
It's easy to set-up and customize
Time Chart charts package is designed to provide you with the most advanced features for time-based data visualization and exploration.

Display modes
Lines, areas, bars & any of them stacked. As well as candle sticks.
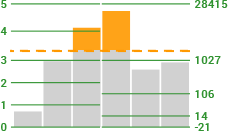
Axis & Thresholds
Single or multi axis. Linear or logarithmic. Add thresholds to monitor peaks.
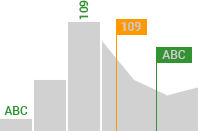
Labels & Markers
Add items,labels and markers to show additional time or data based information.
Features
User Interactions
Drill down
Drill down to a next time measurment unit. E.g.: Drill down from a yearl by months view to a month by days view.
Drill down to timespan
Timeline axis has two time scale informational elements. Upper line shows time scale for the visualized time grain. Bottom line shows information in larger time scale. You are able to reposition and zoom the visible time range to fit bottom lines timeframe.
Drill down to selection
Drill-down and zoom in to a selected time period.
Go back
Return chart to previous state before recent interaction happened.
Zoom in
Zoom in to view a smaller time period./h5>
Finetune zoom
Finetune visible time period of the chart by changing the zoom level and adjusting start and end points of the visible time span by single interaction.
Zoom out
Zoom out to view a larger time period.
Scroll forward
Change the displayed time period to later.
Scroll back
Change the displayed time period to earlier.
Select time period
Select time period of your liking to view totals for the selection and drill-down to the selected time period if you wish.
Change selection
Edit the selected time period.
Remove selection
Remove the selection of the time period.
Show-hide column
Show or hide a column of the chart.
Give it a try!
This is an actual JavaScript chart demo. Hint shows you action to take. Follow the hints to interact with the chart.
Examples
Almost every aspect of TimeChart appearance and functionality can be customized to fit your needs. Rich API enables endless integration options to satisfy most demanding requirements.
Get started with ZoomCharts
Start free to explore the possibilities of the Zoomcharts JavaScript charts library.
Get started