Drill Down Visuals (Pin) vs. Drill Down Visuals (Filter) versions
Each Drill Down Visuals product is available for purchase in two versions – Filter and Pin. Both versions provide the same features and customization options apart from certain use-case specific differences as outlined on this page.

For most report creators, Filter is the recommended choice, while Pin has specific features and optimizations for use with Power BI dashboards.
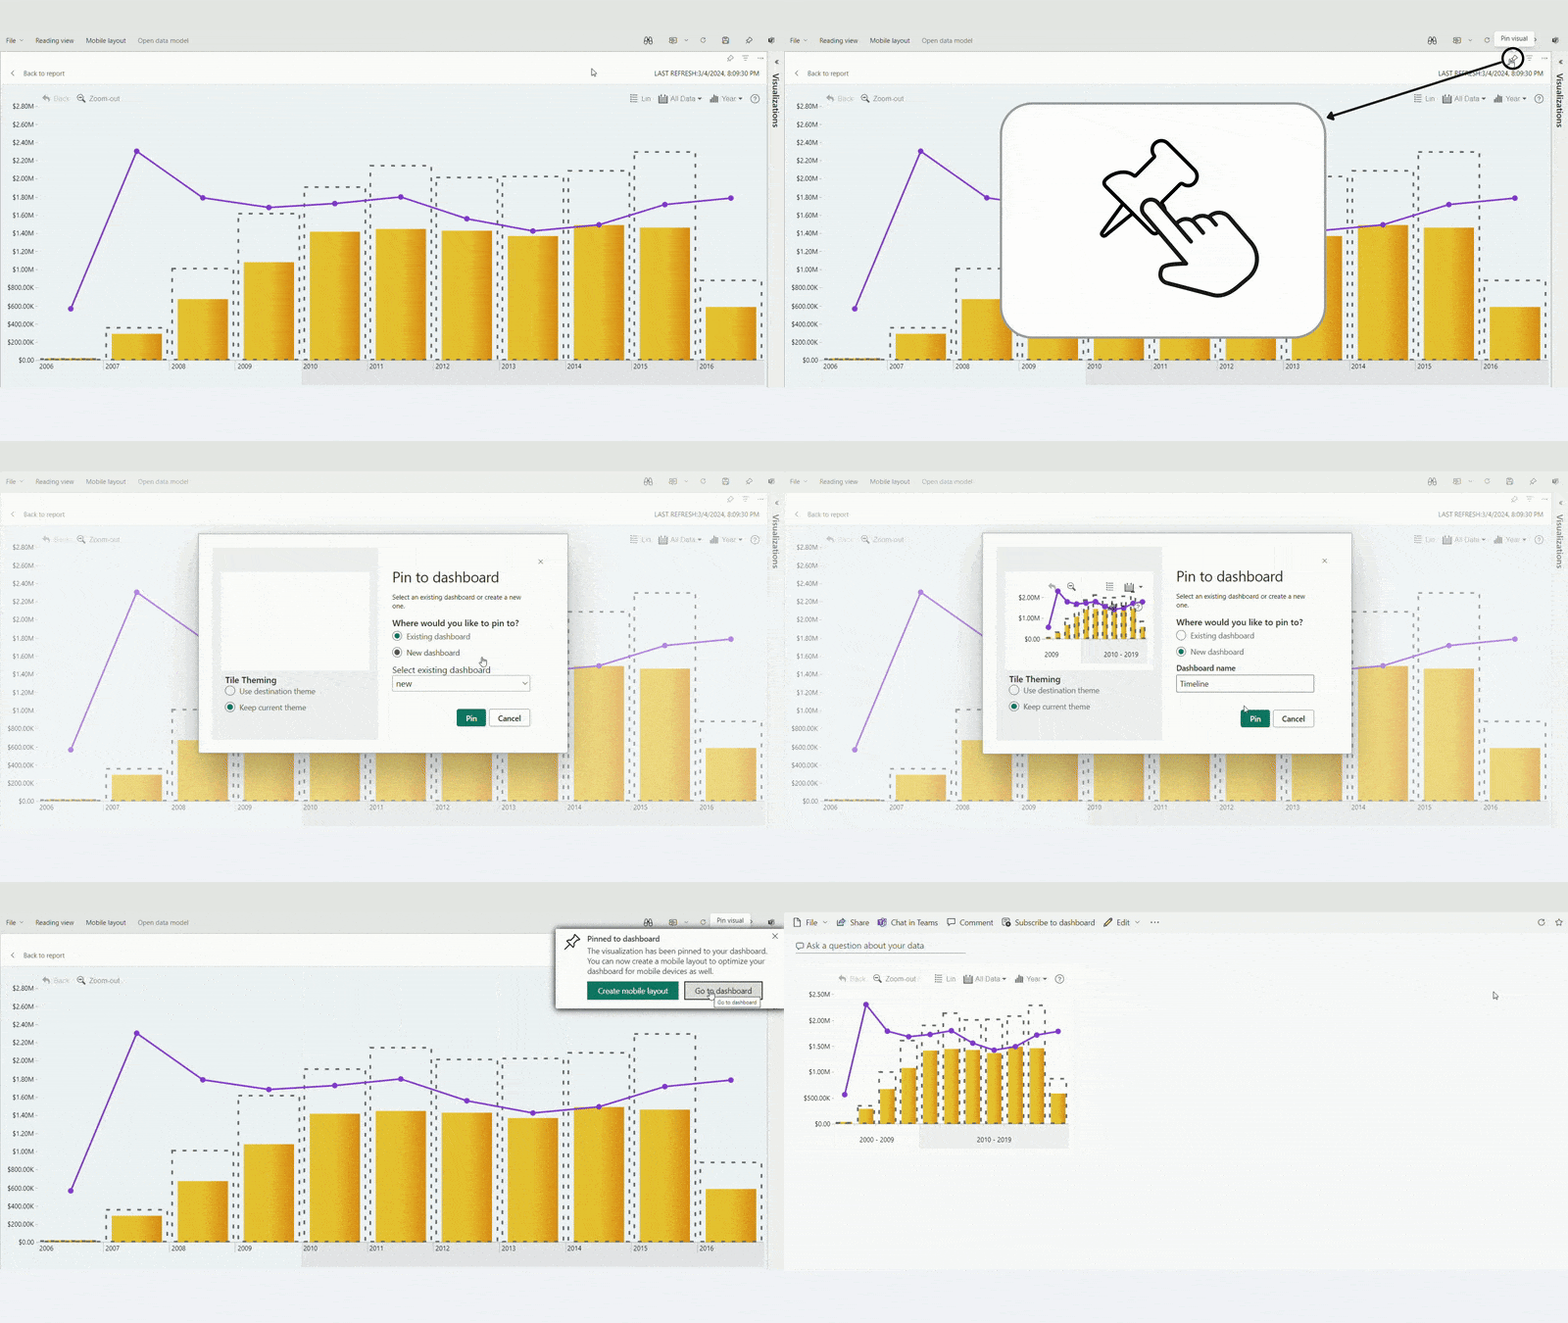
Pin-to-dashboard (only in Pin)
The pin-to-dashboard feature is exclusive to the Pin versions of Drill Down Visuals. It allows creators to pin the visuals directly as a tile on Power BI Service dashboards. If your intended use-case for Drill Down Visuals involves dashboard creation, you should use Pin instead of Filter.
Filter visuals cannot be pinned directly as a tile on Power BI dashboards.

Cross-chart interactions
- Filter: Cross-filter with all visuals
- Pin: Cross-filter with ZoomCharts visuals, cross-highlight with other visuals
While the user interactions for both versions function identically within the visual itself, Pin and Filter differ in how certain user interactions affect other visuals on the same report page (or dashboard).
Filter version
When the user performs a drill down or selects data, a filter will be applied to all visuals on the report page that have cross-filtering enabled, including ZoomCharts visuals, other custom visuals, and Power BI native visuals. When cross-filtering, the filter state is shared across multiple visuals which means that you can make changes to the filter state via any visual back and forth.
Pin version
When the user performs a drill down or selects data, the behavior will differ between ZoomCharts visuals and Power BI native visuals or other custom visuals:
- ZoomCharts visuals: Selecting data in the visual will cross-filter data in other ZoomCharts visuals on the same report page; however, the filter state will be reset when making a selection in a different visual. If you wish to make a combined filter from multiple visuals, hold the CTRL key while making the selection.
- Native Power BI visuals/other visuals with highlighting support: Selecting data in the ZoomCharts visual will cross-highlight data in other visuals on the same report page (if cross-highlighting is enabled); no cross-filtering will be performed.
Was this helpful? Thank you for your feedback!
Sorry about that.
How can we improve it?