logo
For Power BI
  • Products
    • Drill Down Donut Pro Drill Down Donut PRO
    • Drill Down Pie Pro Drill Down Pie PRO
    • Drill TimeSeries Pro Drill Down TimeSeries PRO
    • Drill Combo Pro Drill Down Combo PRO
    • Drill Map Pro Drill Down Map PRO
    • Drill Scatter Pro Drill Down Scatter PRO
    • Drill Down Network Pro Drill Down Network PRO
    • Drill Down Waterfall Pro Drill Down Waterfall PRO
    • Drill Down Graph Pro Drill Down Graph PRO
    • Drill Down Timeline Pro Drill Down Timeline PRO
    • Drill Down Combo Bar PRO Drill Down Combo Bar PRO

    Video tutorials

    Watch Now

    More than 90 videos on how to enhance Power BI with ZoomCharts

    Learn more
    All visuals
  • Resources

      Resources

    • Documentation
    • Report Examples
    • Blog
    • Webinars
    • Video Tutorials
    • Visuals Gallery

    Support

    • ZoomCharts Assistance
    • Contact Sales
    • Contact Support
    • FAQ

    Challenges

    Challenges

    Improve your report creation skills by participating in free challenges for report creators.

    Learn more
    Start trial
  • Services
    • Power BI Report Development
    • Custom Visual Development
  • Challenges
  • Pricing
Request a quote Start Free Book a Demo Sign in
Get it now
Go back

Contents

Go back

Technical Support Analysis

Report Author: Eniola Adekoya

Report
Report Interact

Feel free to leave your vote:

9

Share template with others

Summary

Report submitted for Onyx Data DataDNA ZoomCharts Mini Challenge, May 2024. The report was built based on Tech Support Analysis dataset and includes ZoomCharts custom Drill Down PRO visuals for Power BI. 

Author's description:
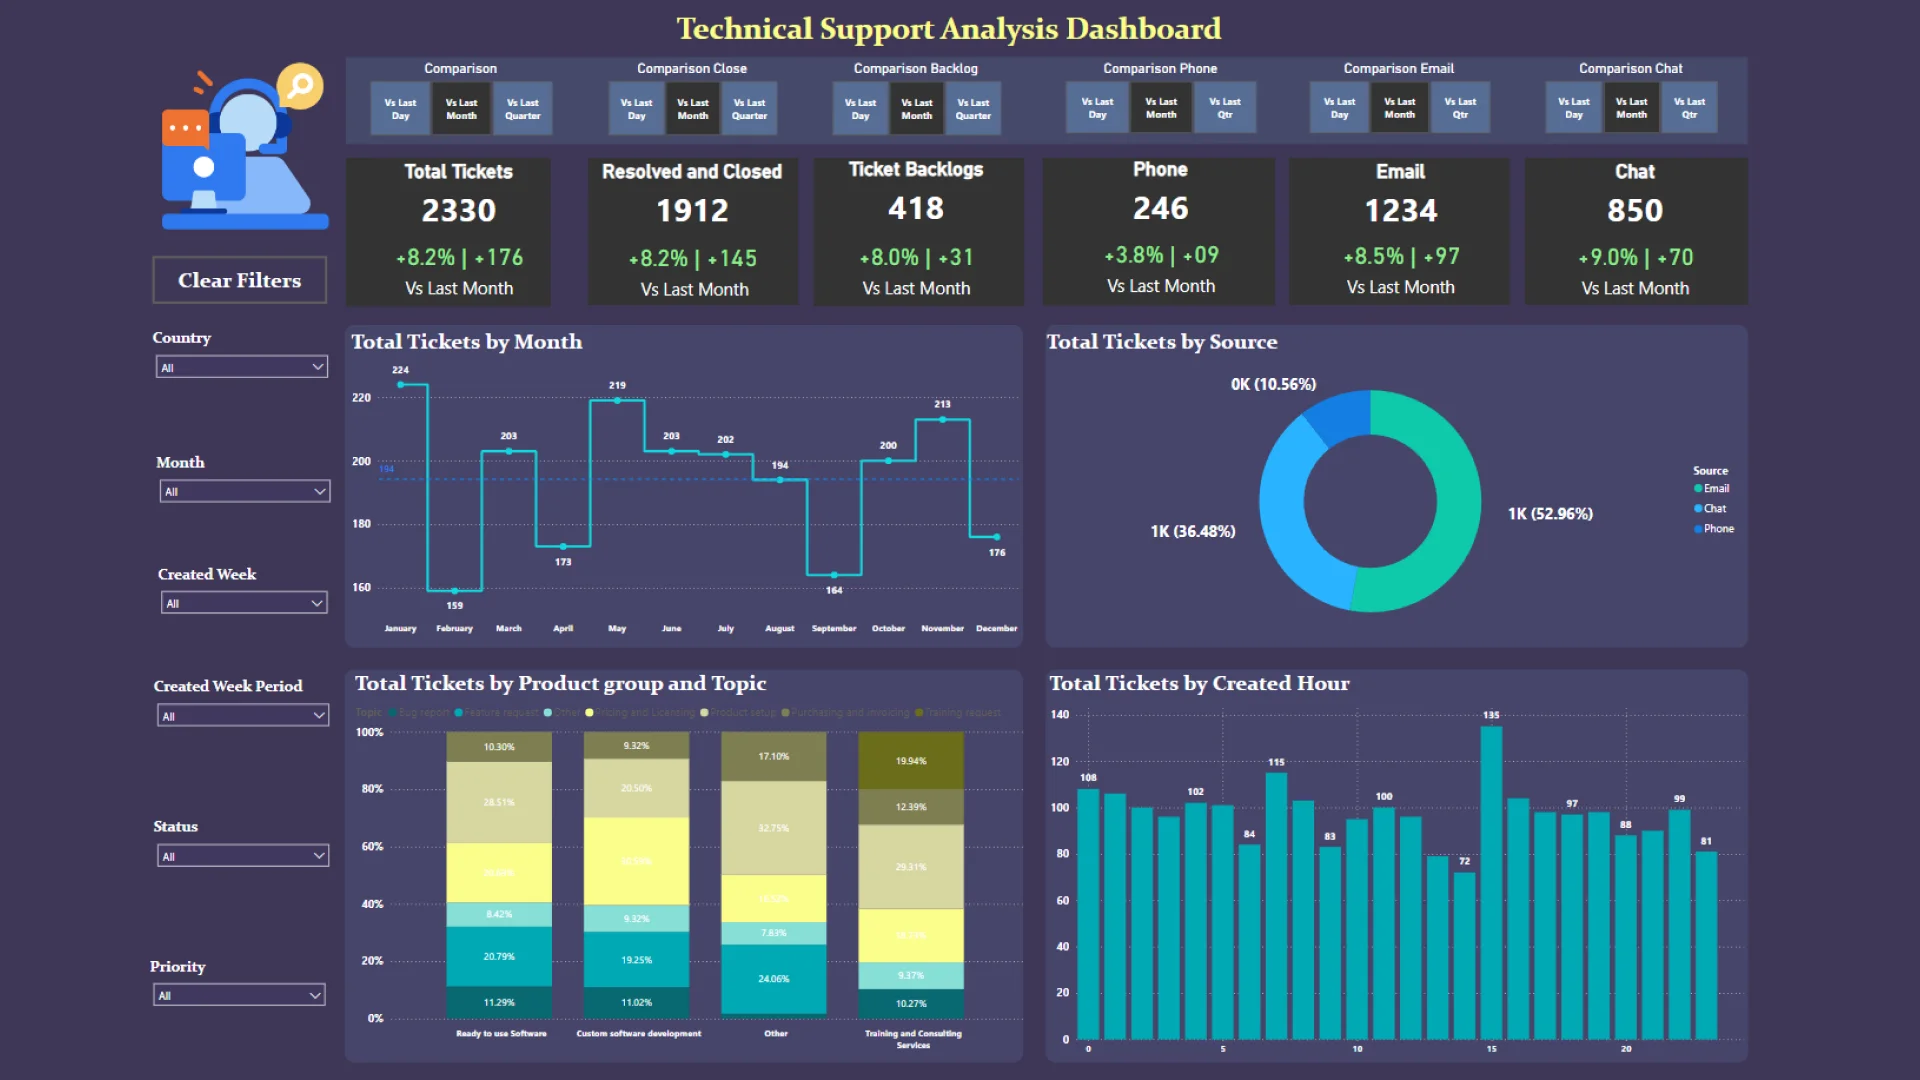
Insights:
Overall Increase in Activity: There is a general increase in the number of tickets, resolved tickets, and backlogs. This suggests a higher demand for support services.
Channel Distribution: The majority of tickets come through email (52.96%), followed by chat (36.48%), and phone (10.56%). Email and chat are the primary channels of customer interaction.
Monthly Trends: Ticket volumes fluctuate throughout the year, with notable peaks in March and dips in August. This could indicate seasonal variations in demand.
High-Activity Hours: Peak times for ticket creation are around 10 AM and 2 PM. This suggests specific hours when support demand is highest.
Product Group and Topic: The distribution of tickets across different product groups and topics shows which areas are generating the most support requests. "Ready to use Software" and "Custom software development" are prominent categories.
Next Best Actions: Resource Allocation:
Increase staffing during peak hours: Adjust work shifts to ensure more support staff are available around 10 AM and 2 PM to handle the higher volume of tickets.
Focus on high-demand channels: Given the high volume of email and chat tickets, allocate more resources to these channels to ensure quick response times.

Backlog Management:
Implement backlog reduction strategies: Develop a plan to address the increase in ticket backlogs. This could include additional temporary staff or overtime to reduce the backlog to manageable levels.

Seasonal Planning:
Prepare for seasonal fluctuations: Analyze historical data to better prepare for months with higher ticket volumes. Ensure adequate staffing and resources during these periods to maintain service levels.

Product and Topic-Specific Actions:
Targeted improvements: Identify common issues within high-volume product groups and topics. Implement training for support staff and improve documentation to reduce the number of tickets.
Proactive support measures: Develop proactive support measures, such as webinars, FAQs, or automated solutions, for the most common issues in the "Ready to use Software" and "Custom software development" categories.

Channel Optimization:
Enhance email and chat support: Given the high volume of tickets through these channels, invest in better tools, training, and processes to handle these tickets efficiently. Explore automation: Implement chatbots or automated email responses for common queries to reduce the load on human agents.

Customer Feedback and Improvement:
Collect and analyze customer feedback: Regularly gather feedback from customers about their support experiences to identify areas for improvement. Continuous improvement: Use feedback to refine support processes, improve response times, and enhance the overall customer experience.

ZoomCharts visuals used

Drill Down Combo PRO Drill Down Combo PRO

Mobile view allows you to interact with the report. To Download the template please switch to desktop view.

Try it in your Power BI!

New here? Fill up the form below and download!

Enjoy!

Success

Thank you for downloading the template!
We have sent a download link to your email.

For any questions, please contact us at ZoomCharts Assistance

Log in

Forgot password

Reset Password

Technical Support Analysis

Share

Unfortunately this report file could not be downloaded. Please try again later.

You can contact support using chat or via email [email protected]

logo
[email protected]
+44 204 577 3993
logo

Products

Drill Down Network PRO Drill Down Waterfall PRO Drill Down Graph PRO Drill Down Combo PRO Drill Down Combo Bar PRO Drill Down Donut PRO Drill Down Pie PRO Drill Down TimeSeries PRO Drill Down Timeline PRO Drill Down Map PRO Drill Down Scatter PRO All Visuals

Resources

Report Examples Webinars Blog ZoomCharts Academy Visuals Gallery Documentation Custom Visual Development Subscribe to News

Solutions

Custom Visual Development

Company

Pricing About Us Partners Leave feedback Join PowerGroup EU Funding

Help

ZoomCharts Assistance Contact Sales Contact Support FAQ

Drill Down Network PRO Drill Down Waterfall PRO Drill Down Graph PRO Drill Down Combo PRO Drill Down Combo Bar PRO Drill Down Donut PRO Drill Down Pie PRO Drill Down TimeSeries PRO Drill Down Timeline PRO Drill Down Map PRO Drill Down Scatter PRO All Visuals

Report Examples Webinars Blog ZoomCharts Academy Visuals Gallery Documentation Custom Visual Development Subscribe to News

Custom Visual Development

Pricing About Us Partners Leave feedback Join PowerGroup EU Funding

ZoomCharts Assistance Contact Sales Contact Support FAQ
+44 204 577 3993
[email protected]

Ready to get in touch?

Contact our experts with any question about Power BI and ZoomCharts for Free!

Contact us

© 2025, Data Visualization Software Lab

U.S. Patents No. 11,645,343; 11,921,804

Cookies Policy
Manage cookies
Privacy Policy
Global
EULA
Patent
warning

Error message

success

Success info: Done!

ZoomCharts AI Assistant

We noticed you're using an old OS version.

For the best experience, we recommend upgrading to ensure that all website features display correctly.

Cookie settings

We use necessary cookies for site functionality, as well as statistic, marketing, and preference cookies to enhance your experience. For more information and to manage your preferences, please visit our Cookie policy