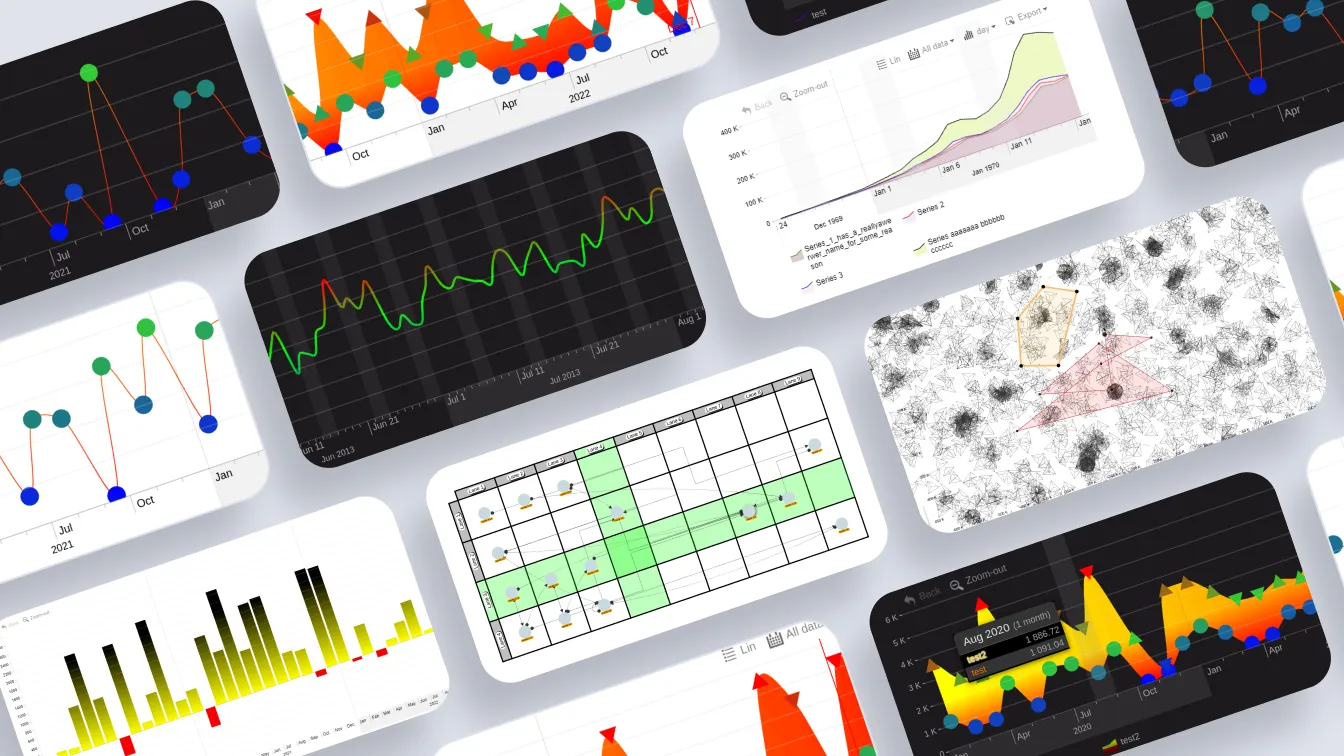
Visualization is to data what color is to television – both allow to rediscover something we knew in a whole new light. With data universe rapidly expanding, people are eager to know what insights it holds. With data visualization software developers can step up and deliver this knowledge.

Thanks to the mushrooming of mobile devices and software, the world is now in over its head in data. We are overwhelmed by non-stop streams of data of different variety and relevancy.  The tasks now are to, first, figure out how to make sense of all this data and, second, decide how to use the data in a way that improves our decision making and quality of life.

The EMC 2014 Digital Universe study revealed that the digital universe is expected to grow from 4.4 to 44 zettabytes in 2020. According to this research, 44 zettabytes of memory is equivalent to 6.6 stacks of 128 GB iPad Airs from the Earth to the Moon. That said, not all of the data gets analyzed – in fact, only a fraction of big data is useful. And only a fraction of that fraction – just about 1% - actually gets analyzed. Makes you wonder what’s buried in the rest of the 99%, doesn’t it?

Software developers are uniquely positioned to distill the big data and put the relevant information in the hands of consumers and enterprises. Data visualization happens to be one of the most effective ways for doing that.

The non-stop software market


With software already commanding virtually every aspect of our day-to-day lives, internet of things growing and virtual reality taking off, software developers find themselves right in the center of all the action. Just like the iPad stacks to the Moon, work keeps piling up.

The numbers back it up – in 2016 the global enterprise software spending is expected to grow by 5.3% amounting to $326 billion, while the app industry is expected to bring in revenue of $ 51 billion, surpassing the music industry on the way. Indeed, there isn’t just an app for anything, there are several apps for everything. Applause Analytics at the end of 2015 estimated that there are around 1.5 million apps for iOS and 1.8 million for Android. Obviously, there’s a tough competition in the app market. Can data visualization provide the much needed edge?

Why data visualization matters


The same Applause Analytics report revealed that usability and performance are the most valued attributes among application users. It is easy to see how data visualization can make or break the usability of an application that deals with data and information. It’s not just the how easy data vizualisation is on the eye, it’s also about delivering interaction, consistent performance on all multi-touch device, speed and the ability to work with live data streams.

However, it is not just about delivering top-notch data visualization in apps. Developers can also use data visualization to improve software development process itself. From testing to customer service delivery – ZoomCharts javascript charts and graphs can help demonstrate patterns, relationships and correlations that otherwise would remain hidden. 
 

The challenges of data visualization


Software developers are juggling several things at once when developing software that translate big data into relevant and useful products. They have to deliver consistent experience for users as they move around and switch from device to device. They have to track user behavior and link data from multiple sources. They have to maintain application security that requires ability to detect threats in real-time.

Having to create data visualization from scratch on top of all that would be a daunting task for several reasons.

  • Firstly, these days algorithmic programming skills are hard to come by -  they are short in supply and in high demand. By opting to use ZoomCharts generous javascript charts library, you’ll halfway there already.
  • Secondly, even if you find your programming wiz, creating decent data visualization can be costly and time consuming. Using ZoomCharts will allow you to move along quicker and save those valuable resources.
  • Thirdly, creating data visualization is one thing - creating data vizualisation that can wrangle real time big data, provide visual layering and work with different devices is a whole other ballgame – one that ZoomCharts has mastered.

ZoomCharts is proud to have created an innovative javascript charts library that can help software developers build new data-driven applications.

Why ZoomCharts is the right fit for software developers


ZoomCharts offers software developers world’s most interactive data visualization that can bring to life any relationship, correlation and insight. Consider these benefits of using ZoomCharts for your software development.

  • ZoomCharts is free for developers. ZoomCharts javascript charts and graph library can be accessed for free while the application is being developed and tested – upgrades included, and with no time limit. Developers are required to purchase the license when the application is deployed in production environment.
  • ZoomCharts is pure javascript and HTML5. ZoomCharts can be used with any database and any programming language (including .NET, PHP, Java, Ruby etc.). With minimal amount of code, you’ll be able to deliver outstanding data visualization in your application.
  • ZoomCharts has rich API library that allows for easy integration and thousands of customization options.

ZoomCharts HTML5 charts and graphs library will enrich your applications and provide interactivity that allows users not just passively observe data but actively engage with it.

The bottom line


Don’t hesitate to check out the industry page specially dedicated to software development and find out more about all the ZoomCharts features available for developers. ZoomCharts was created to bring data exploration to a new level. We are certain that our interactive javascript graphs and charts will help you and your users reveal the big picture of the mega-, giga-, terrabytes of data and zoom in on the details making the “search for the devil” both enlightening and delightful.

Subscribe to news

Subscribe to our newsletter and be among the first ones to receive updates about latest developments, releases and other useful information that will help you get the most of our visuals.

Online Examples

See various ZoomCharts exmaples in our online examples gallery. Each of examples has sample source code exposed.

See ZoomCharts examples

ZoomCharts Pricing

ZoomCharts licensing is transparent and simple, yet widely configurable to fit your company's needs and budget.

See pricing

ZoomCharts JavaScript Charts: Best New Features of 2022

2022 was a big year for data visualization, and it was an even bigger year for ZoomCharts JavaScript Charts. We implemented many useful and much-requested features such as conditional formatting, new data aggregation options, and more. We’re even more excited to share the upcoming features that you can expect in 2023. Read all about them!

Read More

Dec 22, 2022

Analyze your Google Sheets data with ZoomCharts Spreadsheet Analytics

ZoomCharts Spreadsheet Analytics is a tool that allows you to receive an instant interactive report out of your spreadsheet data just by browsing that... Read More

Jan 05, 2017

Turn your spreadsheets into interactive reports in seconds

We introduce Spreadsheet Analytics. That means there is a new way to visualize and explore your spreadsheet data. Spreadsheet Analytics is an application build... Read More

Nov 09, 2016

Data Visualization for Cyber Security

Big Data is no longer the hype that it used to be till a couple of years back. It’s a reality now – the data revolution is already here. The web has... Read More

Feb 09, 2016

Data Visualisation for Online Banking

How do you feel when you are presented with a large volume of unexciting data which can actually take hours to extract any meaningful insight? To be more... Read More

Feb 02, 2016

Ho Ho Holiday Special Offer from ZoomCharts

The ZoomCharts team wishes you happy holidays and a very special New Year! To make the most out of the next year, we've came up with a special holiday deal for... Read More

Dec 15, 2015

Approaching Businesses at Data Visualisation Summit in London

When Data Visualisation Summit announced its slogan “Telling your story with data”, we knew the ZoomCharts team had to exhibit there, so on November 11-12... Read More

Dec 10, 2015

Exhibiting at TechCrunch Disrupt in London

Another great chance to put us on the radar of potential customers! We're exhibiting at TechCrunch Disrupt in London on December 7-8. TechCrunch Disrupt is... Read More

Dec 04, 2015

Starting Big at Web Summit 2015 in Dublin

The ZoomCharts team had an opportunity to attend Web Summit 2015 on November 3-5 in Dublin, one of the largest technology conferences in the world. The... Read More

Dec 04, 2015

TypeRacer Fans Can Now Compare and Visualize Their Scores

Are you a fan of TypeRacer.com? Want to see the big picture of your typing progress since the beginnings? Compare your performance with the scores of your... Read More

Nov 25, 2015

Meet Us at Data Visualisation Summit in London

To help you get more out of ZoomCharts, we'd love to meet you in person and show you our newest features. As our team is going to London on November 10-13,... Read More

Oct 28, 2015

Battling for Best Startup Title at Web Summit in Dublin

Proud to announce ZoomCharts has been shortlisted for the Web Summit BETA pitch! We'll be battling in front of the world’s leading investors, media and... Read More

Oct 28, 2015

ZoomCharts Receives Rising Star Title

Awesome news! On October 22nd, ZoomCharts received the “Rising Star” title and was named as one of Latvia's best new exporting brands. “Rising... Read More

Oct 28, 2015

ZoomCharts v1.9 - Setting Milestones

ZoomCharts v1.9 is now available! ZoomCharts has always been a niche leader but now our multi-touch support has got even better! See the new features in a... Read More

Oct 13, 2015

Your Powerpoint presentations will come alive with ZoomCharts!

With almost every presentation we create, we face a fundamental challenge – how to display and present huge amount of data without losing audience interest... Read More

Aug 25, 2015

ZoomCharts Experience: Episode 4, Performance

ZoomCharts HTML5 charts are built with a particular focus on mobile users. Fluid animations, speedy rendering, multitouch support, Big Data readiness are just... Read More

Aug 05, 2015

ZoomCharts Experience: Episode 3, Date Picker

Exploring the intricate details of your big data sets can be frustrating when your tools do not provide you with the functionality you require to go deeper... Read More

May 21, 2015

Happy Easter from ZoomCharts!

From the entire ZoomCharts team, we’d like to wish everyone a safe and happy Easter, whether your plans consist of a large consumption of food, chocolate,... Read More

Apr 01, 2015

ZoomCharts Experience: Episode 1, Swipe & Pinch

This is the first installment in the new ZoomCharts Experience video series. These video shorts will continue on a regular basis to offer a fun, fast, and... Read More

Mar 26, 2015

ZoomCharts at TechHub Riga Meetup: March 12, 2015

ZoomCharts is very excited to be part of the TechHub Rīga Meetup on March 12, 2015, taking place at Kaļķu street 12/14, Rīga, LV-1050, Latvia.... Read More

Feb 27, 2015

ZoomCharts Featured on Japanese Website nikkei BPnet

ZoomCharts is proud to have been named among the best data visualization providers by Japanese technology website, nikkei BPnet. One of ZoomCharts’... Read More

Feb 27, 2015

Happy New Year from ZoomCharts!

From the entire team here at ZoomCharts, we would like to extend a big thank you to all of our loyal customers and potential clients who have expressed... Read More

Dec 31, 2014